|
Download Data (XLS File) |
|
||||||||
|
||||||||
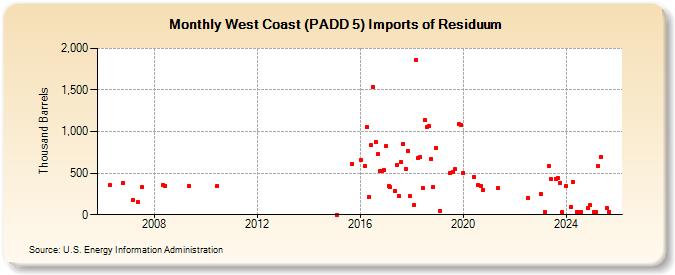
| West Coast (PADD 5) Imports of Residuum (Thousand Barrels) | ||||||||
| Year | Jan | Feb | Mar | Apr | May | Jun | Jul | Aug | Sep | Oct | Nov | Dec |
|---|---|---|---|---|---|---|---|---|---|---|---|---|
| 2006 | 353 | 386 | ||||||||||
| 2007 | 176 | 150 | 333 | |||||||||
| 2008 | 352 | 351 | ||||||||||
| 2009 | 348 | |||||||||||
| 2010 | 344 | |||||||||||
| 2015 | 1 | 613 | ||||||||||
| 2016 | 660 | 585 | 1,057 | 212 | 833 | 1,541 | 880 | 728 | 530 | 524 | 534 | |
| 2017 | 826 | 343 | 331 | 290 | 597 | 220 | 635 | 855 | 554 | 767 | 221 | |
| 2018 | 115 | 1,863 | 683 | 689 | 316 | 1,140 | 1,055 | 1,066 | 672 | 336 | 807 | |
| 2019 | 45 | 504 | 512 | 546 | 1,089 | 1,081 | ||||||
| 2020 | 504 | 459 | 353 | 347 | 298 | |||||||
| 2021 | 320 | |||||||||||
| 2022 | 202 | |||||||||||
| 2023 | 254 | 38 | 582 | 426 | 430 | 443 | 383 | 33 | ||||
| 2024 | 341 | |||||||||||
| - = No Data Reported; -- = Not Applicable; NA = Not Available; W = Withheld to avoid disclosure of individual company data. |
| Release Date: 3/29/2024 |
| Next Release Date: 4/30/2024 |