|
Download Data (XLS File) |
|
||||||||
|
||||||||
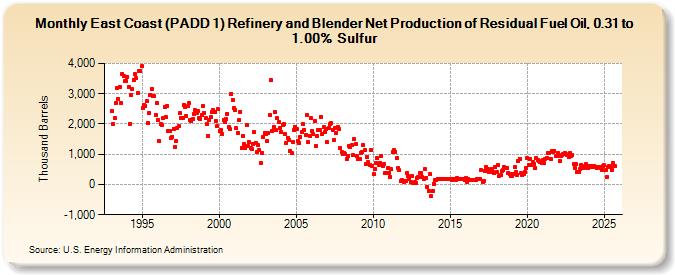
| East Coast (PADD 1) Refinery and Blender Net Production of Residual Fuel Oil, 0.31 to 1.00% Sulfur (Thousand Barrels) | ||||||||
| Year | Jan | Feb | Mar | Apr | May | Jun | Jul | Aug | Sep | Oct | Nov | Dec |
|---|---|---|---|---|---|---|---|---|---|---|---|---|
| 1993 | 2,417 | 2,009 | 2,213 | 2,697 | 3,188 | 2,813 | 3,224 | 2,687 | 3,659 | 3,576 | 3,415 | 3,424 |
| 1994 | 3,555 | 3,233 | 2,015 | 2,952 | 3,155 | 3,464 | 3,638 | 3,511 | 3,019 | 3,739 | 3,756 | 3,907 |
| 1995 | 2,540 | 2,640 | 2,601 | 2,747 | 2,028 | 2,361 | 2,962 | 3,164 | 2,920 | 2,924 | 2,309 | 2,694 |
| 1996 | 2,145 | 1,424 | 1,989 | 1,963 | 2,190 | 2,561 | 2,219 | 2,598 | 1,763 | 1,780 | 1,534 | 1,583 |
| 1997 | 1,842 | 1,243 | 1,439 | 1,880 | 1,928 | 2,353 | 2,195 | 2,191 | 2,639 | 2,573 | 2,269 | 2,582 |
| 1998 | 2,680 | 2,128 | 2,094 | 2,174 | 2,343 | 2,446 | 2,356 | 2,421 | 2,206 | 2,177 | 2,313 | 2,589 |
| 1999 | 2,357 | 2,204 | 1,985 | 1,604 | 2,130 | 2,246 | 2,382 | 2,450 | 2,386 | 2,096 | 1,923 | 2,482 |
| 2000 | 1,770 | 1,797 | 1,665 | 2,137 | 2,070 | 2,155 | 2,345 | 1,899 | 1,832 | 3,007 | 2,805 | 2,517 |
| 2001 | 2,471 | 1,858 | 1,702 | 2,130 | 2,410 | 1,213 | 1,618 | 1,336 | 1,192 | 1,964 | 1,287 | 1,389 |
| 2002 | 1,194 | 1,187 | 1,353 | 1,730 | 1,365 | 1,059 | 1,295 | 1,126 | 726 | 1,042 | 1,560 | 1,694 |
| 2003 | 1,681 | 1,425 | 1,689 | 2,311 | 3,441 | 1,768 | 1,900 | 2,390 | 1,795 | 2,185 | 2,050 | 1,863 |
| 2004 | 1,727 | 1,953 | 1,986 | 1,664 | 1,382 | 1,551 | 1,477 | 1,106 | 1,032 | 1,413 | 1,807 | 1,915 |
| 2005 | 1,837 | 1,435 | 1,377 | 1,584 | 1,731 | 1,998 | 1,810 | 1,632 | 2,284 | 1,390 | 1,618 | 2,182 |
| 2006 | 1,772 | 1,654 | 2,089 | 1,276 | 1,590 | 1,812 | 1,795 | 2,242 | 1,683 | 1,886 | 1,749 | 1,849 |
| 2007 | 1,396 | 1,860 | 1,985 | 2,029 | 1,810 | 1,471 | 1,862 | 1,708 | 1,914 | 1,842 | 1,195 | 1,071 |
| 2008 | 1,020 | 1,048 | 1,002 | 841 | 954 | 1,281 | 1,233 | 1,296 | 963 | 1,494 | 1,346 | 926 |
| 2009 | 840 | 827 | 1,050 | 1,067 | 1,310 | 1,125 | 675 | 910 | 735 | 632 | 1,132 | 600 |
| 2010 | 344 | 509 | 717 | 868 | 652 | 725 | 939 | 616 | 676 | 373 | 392 | 541 |
| 2011 | 384 | 253 | 497 | 1,071 | 1,127 | 1,088 | 872 | 544 | 470 | 103 | 147 | 120 |
| 2012 | 85 | 121 | 385 | 271 | 187 | 68 | 274 | 44 | 68 | 39 | 218 | 231 |
| 2013 | 372 | 372 | 241 | 183 | 501 | 225 | -83 | -204 | 347 | -385 | -219 | 17 |
| 2014 | 155 | 156 | 189 | 186 | 172 | 192 | 190 | 187 | 178 | 197 | 190 | 191 |
| 2015 | 174 | 157 | 182 | 170 | 164 | 201 | 185 | 184 | 166 | 171 | 190 | 162 |
| 2016 | 216 | 82 | 177 | 153 | 160 | 162 | 164 | 164 | 158 | 165 | 193 | 180 |
| 2017 | 471 | 95 | 131 | 453 | 582 | 516 | 408 | 457 | 514 | 405 | 368 | 564 |
| 2018 | 414 | 651 | 291 | 297 | 455 | 470 | 561 | 545 | 556 | 376 | 337 | 267 |
| 2019 | 292 | 346 | 570 | 406 | 326 | 767 | 857 | 369 | 316 | 340 | 411 | 528 |
| 2020 | 869 | 631 | 840 | 658 | 750 | 687 | 542 | 867 | 817 | 775 | 744 | 716 |
| 2021 | 806 | 698 | 858 | 870 | 1,031 | 1,035 | 858 | 1,094 | 1,059 | 1,121 | 929 | 942 |
| 2022 | 1,040 | 778 | 950 | 987 | 994 | 1,053 | 993 | 979 | 918 | 1,033 | 928 | 959 |
| 2023 | 667 | 556 | 674 | 409 | 397 | 524 | 660 | 544 | 553 | 627 | 662 | 556 |
| 2024 | 618 | 575 | 597 | 561 | ||||||||
| - = No Data Reported; -- = Not Applicable; NA = Not Available; W = Withheld to avoid disclosure of individual company data. |
| Release Date: 6/28/2024 |
| Next Release Date: 7/31/2024 |