|
Download Data (XLS File) |
|
||||||||
|
||||||||
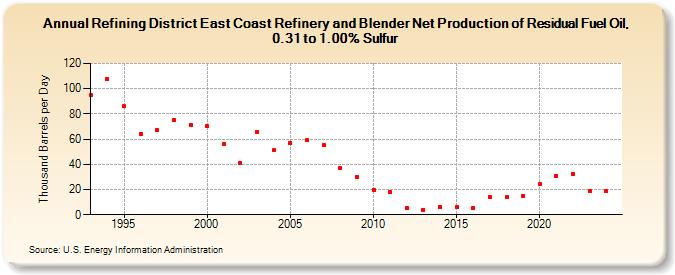
| Refining District East Coast Refinery and Blender Net Production of Residual Fuel Oil, 0.31 to 1.00% Sulfur (Thousand Barrels per Day) | ||||||||
| Decade | Year-0 | Year-1 | Year-2 | Year-3 | Year-4 | Year-5 | Year-6 | Year-7 | Year-8 | Year-9 |
|---|---|---|---|---|---|---|---|---|---|---|
| 1990's | 95 | 108 | 86 | 64 | 67 | 75 | 71 | |||
| 2000's | 70 | 56 | 41 | 66 | 51 | 57 | 59 | 55 | 37 | 30 |
| 2010's | 20 | 18 | 5 | 4 | 6 | 6 | 5 | 14 | 14 | 15 |
| 2020's | 24 | 31 | 32 | 19 |
| - = No Data Reported; -- = Not Applicable; NA = Not Available; W = Withheld to avoid disclosure of individual company data. |
| Release Date: 3/29/2024 |
| Next Release Date: 8/30/2024 |