|
Download Data (XLS File) |
|
||||||||
|
||||||||
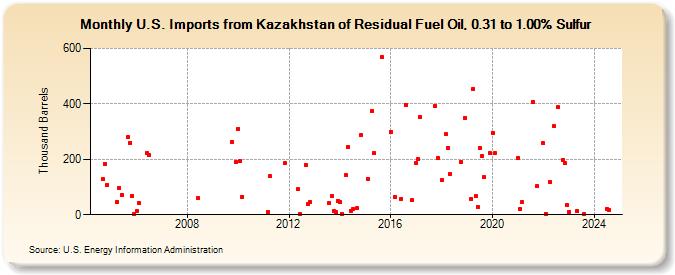
| U.S. Imports from Kazakhstan of Residual Fuel Oil, 0.31 to 1.00% Sulfur (Thousand Barrels) | ||||||||
| Year | Jan | Feb | Mar | Apr | May | Jun | Jul | Aug | Sep | Oct | Nov | Dec |
|---|---|---|---|---|---|---|---|---|---|---|---|---|
| 2004 | 128 | 183 | 108 | |||||||||
| 2005 | 47 | 97 | 72 | 280 | 260 | 68 | 1 | |||||
| 2006 | 12 | 44 | 223 | 216 | ||||||||
| 2008 | 60 | |||||||||||
| 2009 | 264 | 191 | ||||||||||
| 2010 | 311 | 192 | 65 | |||||||||
| 2011 | 9 | 138 | 186 | |||||||||
| 2012 | 91 | 2 | 179 | 40 | 45 | |||||||
| 2013 | 41 | 66 | 13 | 9 | 51 | |||||||
| 2014 | 45 | 2 | 142 | 246 | 14 | 19 | 23 | 287 | ||||
| 2015 | 129 | 375 | 223 | 569 | ||||||||
| 2016 | 299 | 65 | 58 | 395 | 52 | |||||||
| 2017 | 187 | 200 | 353 | 392 | 204 | |||||||
| 2018 | 125 | 290 | 242 | 148 | 190 | 350 | ||||||
| 2019 | 57 | 455 | 66 | 28 | 240 | 213 | 136 | 221 | ||||
| 2020 | 296 | 221 | ||||||||||
| 2021 | 205 | 20 | 45 | 407 | 102 | |||||||
| 2022 | 257 | 4 | 119 | 319 | 388 | 199 | 185 | 34 | ||||
| 2023 | 11 | 12 | 2 | |||||||||
| - = No Data Reported; -- = Not Applicable; NA = Not Available; W = Withheld to avoid disclosure of individual company data. |
| Release Date: 3/29/2024 |
| Next Release Date: 4/30/2024 |