|
Download Data (XLS File) |
|
||||||||
|
||||||||
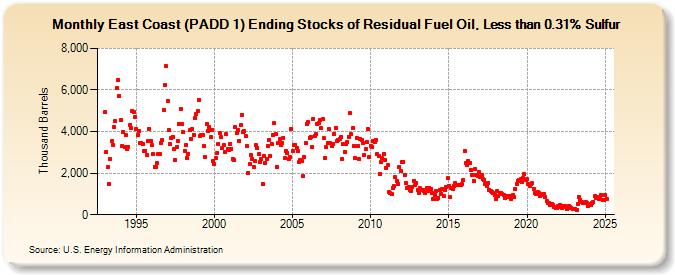
| East Coast (PADD 1) Ending Stocks of Residual Fuel Oil, Less than 0.31% Sulfur (Thousand Barrels) | ||||||||
| Year | Jan | Feb | Mar | Apr | May | Jun | Jul | Aug | Sep | Oct | Nov | Dec |
|---|---|---|---|---|---|---|---|---|---|---|---|---|
| 1993 | 4,928 | 3,033 | 2,271 | 1,486 | 2,666 | 3,528 | 3,375 | 4,237 | 4,495 | 6,101 | 6,484 | 5,724 |
| 1994 | 4,539 | 3,296 | 3,986 | 3,266 | 3,816 | 3,140 | 3,270 | 4,315 | 4,188 | 4,990 | 4,935 | 4,686 |
| 1995 | 4,102 | 3,817 | 4,024 | 3,462 | 3,442 | 3,423 | 3,056 | 3,081 | 2,849 | 3,523 | 4,138 | 3,522 |
| 1996 | 3,339 | 2,907 | 2,316 | 2,280 | 2,465 | 2,926 | 2,936 | 3,462 | 3,570 | 5,030 | 6,228 | 7,134 |
| 1997 | 5,446 | 4,079 | 3,404 | 3,670 | 3,758 | 3,157 | 2,640 | 3,256 | 3,540 | 4,376 | 5,078 | 4,347 |
| 1998 | 3,997 | 3,070 | 3,340 | 2,724 | 2,928 | 4,061 | 3,657 | 4,130 | 3,840 | 4,670 | 4,822 | 4,979 |
| 1999 | 5,540 | 3,788 | 3,851 | 3,857 | 3,325 | 2,754 | 4,384 | 4,035 | 4,230 | 3,730 | 4,090 | 2,601 |
| 2000 | 2,428 | 2,707 | 2,974 | 3,402 | 3,908 | 3,732 | 3,213 | 3,343 | 3,010 | 3,868 | 3,169 | 3,115 |
| 2001 | 3,403 | 3,176 | 2,685 | 2,648 | 4,198 | 3,933 | 4,075 | 3,567 | 4,309 | 4,816 | 3,960 | 4,009 |
| 2002 | 3,764 | 3,328 | 2,000 | 2,437 | 2,895 | 2,688 | 2,312 | 2,607 | 3,339 | 3,227 | 2,918 | 2,538 |
| 2003 | 2,673 | 1,463 | 2,806 | 2,500 | 2,703 | 3,313 | 3,583 | 2,844 | 3,404 | 3,839 | 4,397 | 3,861 |
| 2004 | 2,284 | 3,448 | 3,624 | 3,341 | 3,438 | 3,707 | 2,736 | 3,086 | 2,957 | 2,666 | 2,784 | 4,128 |
| 2005 | 3,088 | 3,355 | 3,371 | 3,198 | 3,062 | 2,552 | 2,646 | 2,571 | 1,854 | 2,778 | 3,429 | 4,383 |
| 2006 | 4,455 | 3,703 | 3,756 | 3,250 | 4,616 | 3,784 | 3,890 | 4,364 | 4,405 | 4,547 | 4,154 | 4,595 |
| 2007 | 3,674 | 2,742 | 3,243 | 3,469 | 4,109 | 3,426 | 3,298 | 3,397 | 3,897 | 4,186 | 3,527 | 3,604 |
| 2008 | 3,643 | 3,726 | 2,695 | 3,404 | 3,030 | 3,387 | 3,496 | 3,744 | 4,876 | 3,871 | 4,151 | 3,306 |
| 2009 | 2,724 | 3,690 | 3,325 | 2,679 | 3,658 | 3,581 | 3,430 | 2,854 | 3,148 | 3,502 | 4,109 | 2,780 |
| 2010 | 3,303 | 3,280 | 3,547 | 3,520 | 3,596 | 2,906 | 2,802 | 1,974 | 2,519 | 2,708 | 2,931 | 2,634 |
| 2011 | 2,233 | 2,393 | 1,075 | 1,043 | 985 | 1,295 | 1,363 | 1,792 | 1,598 | 1,472 | 2,317 | 2,102 |
| 2012 | 2,542 | 2,549 | 1,919 | 1,517 | 1,272 | 1,338 | 1,191 | 1,152 | 1,322 | 1,638 | 1,448 | 1,530 |
| 2013 | 1,212 | 1,053 | 1,266 | 1,180 | 1,179 | 1,121 | 1,067 | 1,271 | 1,137 | 1,302 | 1,215 | 1,045 |
| 2014 | 748 | 936 | 1,130 | 770 | 806 | 1,170 | 1,000 | 1,246 | 905 | 1,165 | 1,346 | 1,759 |
| 2015 | 1,401 | 840 | 1,285 | 1,254 | 1,385 | 1,517 | 1,440 | 1,419 | 1,434 | 1,442 | 1,472 | 1,665 |
| 2016 | 3,067 | 2,471 | 2,371 | 2,561 | 2,501 | 2,140 | 1,908 | 1,629 | 2,184 | 1,907 | 1,851 | 2,057 |
| 2017 | 1,790 | 1,908 | 1,703 | 1,681 | 1,467 | 1,402 | 1,532 | 1,211 | 1,125 | 1,116 | 1,066 | 969 |
| 2018 | 741 | 1,122 | 918 | 1,022 | 1,044 | 996 | 970 | 808 | 894 | 894 | 849 | 901 |
| 2019 | 769 | 933 | 851 | 1,245 | 1,461 | 1,644 | 1,651 | 1,703 | 1,569 | 1,757 | 1,959 | 1,677 |
| 2020 | 1,699 | 1,458 | 1,392 | 1,462 | 1,512 | 1,249 | 1,040 | 1,000 | 1,083 | 1,029 | 884 | 927 |
| 2021 | 994 | 991 | 862 | 663 | 544 | 561 | 473 | 528 | 459 | 385 | 303 | 307 |
| 2022 | 400 | 461 | 364 | 307 | 397 | 406 | 365 | 270 | 409 | 380 | 304 | 293 |
| 2023 | 292 | 290 | 236 | 531 | 829 | 707 | 620 | 587 | 568 | 628 | 554 | 434 |
| 2024 | 503 | |||||||||||
| - = No Data Reported; -- = Not Applicable; NA = Not Available; W = Withheld to avoid disclosure of individual company data. |
| Release Date: 3/29/2024 |
| Next Release Date: 4/30/2024 |