|
Download Data (XLS File) |
|
||||||||
|
||||||||
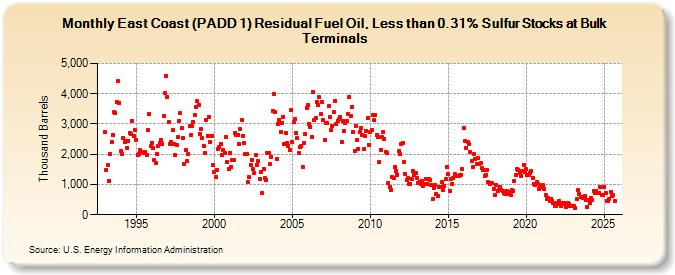
| East Coast (PADD 1) Residual Fuel Oil, Less than 0.31% Sulfur Stocks at Bulk Terminals (Thousand Barrels) | ||||||||
| Year | Jan | Feb | Mar | Apr | May | Jun | Jul | Aug | Sep | Oct | Nov | Dec |
|---|---|---|---|---|---|---|---|---|---|---|---|---|
| 1993 | 2,721 | 1,475 | 1,628 | 1,128 | 2,012 | 2,388 | 2,643 | 3,387 | 3,353 | 3,725 | 4,409 | 3,702 |
| 1994 | 2,092 | 2,022 | 2,527 | 2,389 | 2,429 | 2,198 | 2,453 | 2,716 | 2,654 | 3,107 | 2,601 | 2,790 |
| 1995 | 2,477 | 1,990 | 1,991 | 2,132 | 2,084 | 2,071 | 2,051 | 2,066 | 1,986 | 2,788 | 3,335 | 2,275 |
| 1996 | 2,384 | 2,217 | 1,800 | 1,702 | 1,995 | 2,264 | 2,368 | 2,454 | 2,350 | 3,280 | 4,025 | 4,585 |
| 1997 | 3,902 | 3,051 | 2,325 | 2,410 | 2,812 | 2,337 | 1,969 | 2,298 | 2,558 | 3,110 | 3,366 | 2,856 |
| 1998 | 2,546 | 1,681 | 2,138 | 1,782 | 2,016 | 2,936 | 2,645 | 2,935 | 3,053 | 3,298 | 3,575 | 3,744 |
| 1999 | 3,620 | 2,682 | 2,828 | 2,541 | 2,264 | 2,056 | 3,132 | 2,604 | 3,230 | 2,389 | 2,607 | 1,650 |
| 2000 | 1,403 | 1,242 | 1,488 | 2,165 | 2,233 | 2,350 | 1,970 | 2,138 | 2,047 | 2,578 | 1,740 | 1,527 |
| 2001 | 2,043 | 1,584 | 1,813 | 1,812 | 2,712 | 2,643 | 2,648 | 2,343 | 2,828 | 3,132 | 2,617 | 2,369 |
| 2002 | 2,008 | 2,015 | 1,084 | 1,234 | 1,631 | 1,812 | 1,501 | 1,395 | 1,960 | 1,654 | 1,761 | 1,189 |
| 2003 | 1,401 | 716 | 1,523 | 1,200 | 1,143 | 2,043 | 2,037 | 1,677 | 1,920 | 3,438 | 4,006 | 3,386 |
| 2004 | 1,826 | 3,014 | 3,143 | 2,748 | 3,038 | 3,238 | 2,353 | 2,710 | 2,382 | 2,278 | 2,150 | 3,477 |
| 2005 | 2,403 | 3,053 | 3,155 | 2,686 | 2,522 | 2,038 | 2,249 | 2,262 | 1,562 | 2,358 | 2,654 | 3,544 |
| 2006 | 3,628 | 2,995 | 2,909 | 2,578 | 4,052 | 3,132 | 3,198 | 3,711 | 3,622 | 3,880 | 3,316 | 3,715 |
| 2007 | 3,132 | 2,482 | 3,029 | 3,022 | 3,589 | 3,239 | 2,814 | 2,936 | 3,403 | 3,764 | 2,990 | 3,107 |
| 2008 | 3,156 | 3,219 | 2,420 | 3,102 | 2,763 | 3,041 | 3,086 | 3,319 | 3,904 | 3,272 | 3,565 | 2,728 |
| 2009 | 2,108 | 2,939 | 2,477 | 2,181 | 2,738 | 2,876 | 2,633 | 2,172 | 2,595 | 2,769 | 3,209 | 2,318 |
| 2010 | 2,727 | 2,808 | 3,294 | 3,117 | 3,306 | 2,629 | 2,557 | 1,736 | 2,152 | 2,559 | 2,728 | 2,512 |
| 2011 | 2,057 | 2,053 | 1,044 | 916 | 822 | 1,231 | 1,213 | 1,581 | 1,452 | 1,322 | 2,114 | 2,015 |
| 2012 | 2,350 | 2,379 | 1,755 | 1,362 | 1,142 | 1,203 | 1,002 | 1,029 | 1,170 | 1,435 | 1,326 | 1,372 |
| 2013 | 1,202 | 1,045 | 1,093 | 1,014 | 1,113 | 965 | 1,009 | 1,170 | 1,015 | 1,187 | 1,142 | 986 |
| 2014 | 512 | 870 | 984 | 688 | 608 | 916 | 924 | 1,089 | 823 | 957 | 1,174 | 1,571 |
| 2015 | 1,342 | 783 | 1,184 | 1,025 | 1,200 | 1,333 | 1,292 | 1,271 | 1,274 | 1,320 | 1,300 | 1,517 |
| 2016 | 2,855 | 2,425 | 2,219 | 2,420 | 2,343 | 2,088 | 1,769 | 1,561 | 2,012 | 1,854 | 1,692 | 1,891 |
| 2017 | 1,692 | 1,705 | 1,533 | 1,487 | 1,275 | 1,322 | 1,476 | 1,073 | 1,002 | 1,056 | 1,033 | 855 |
| 2018 | 662 | 972 | 793 | 820 | 919 | 816 | 783 | 714 | 694 | 778 | 693 | 766 |
| 2019 | 664 | 802 | 779 | 1,110 | 1,310 | 1,516 | 1,488 | 1,387 | 1,296 | 1,439 | 1,639 | 1,402 |
| 2020 | 1,511 | 1,306 | 1,325 | 1,394 | 1,434 | 1,229 | 1,021 | 979 | 1,067 | 1,011 | 863 | 906 |
| 2021 | 974 | 972 | 846 | 647 | 530 | 547 | 458 | 513 | 443 | 372 | 286 | 288 |
| 2022 | 379 | 444 | 348 | 290 | 374 | 388 | 351 | 252 | 394 | 361 | 292 | 275 |
| 2023 | 277 | 277 | 224 | 515 | 812 | 690 | 601 | 573 | 554 | 610 | 473 | 251 |
| 2024 | 478 | 396 | 539 | 501 | ||||||||
| - = No Data Reported; -- = Not Applicable; NA = Not Available; W = Withheld to avoid disclosure of individual company data. |
| Release Date: 6/28/2024 |
| Next Release Date: 7/31/2024 |