|
Download Data (XLS File) |
|
||||||||
|
||||||||
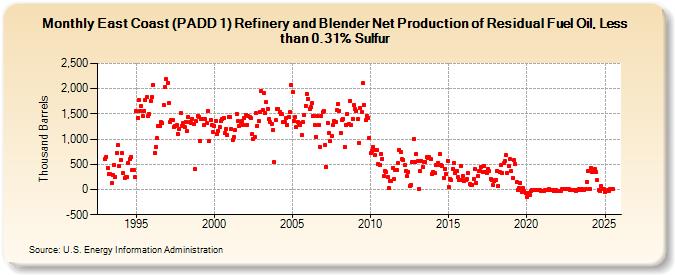
| East Coast (PADD 1) Refinery and Blender Net Production of Residual Fuel Oil, Less than 0.31% Sulfur (Thousand Barrels) | ||||||||
| Year | Jan | Feb | Mar | Apr | May | Jun | Jul | Aug | Sep | Oct | Nov | Dec |
|---|---|---|---|---|---|---|---|---|---|---|---|---|
| 1993 | 599 | 651 | 431 | 301 | 304 | 123 | 295 | 493 | 257 | 725 | 879 | 471 |
| 1994 | 590 | 715 | 331 | 231 | 254 | 243 | 532 | 598 | 650 | 387 | 388 | 241 |
| 1995 | 1,551 | 1,409 | 1,774 | 1,554 | 1,661 | 1,463 | 1,564 | 1,783 | 1,832 | 1,450 | 1,502 | 1,757 |
| 1996 | 1,832 | 2,072 | 726 | 841 | 1,015 | 1,255 | 1,250 | 1,331 | 1,317 | 1,681 | 2,028 | 2,184 |
| 1997 | 2,121 | 1,719 | 1,333 | 1,384 | 1,370 | 1,238 | 1,267 | 1,273 | 1,107 | 1,203 | 1,515 | 1,264 |
| 1998 | 1,329 | 1,241 | 1,349 | 1,152 | 1,443 | 1,344 | 1,319 | 1,406 | 1,301 | 399 | 1,353 | 1,464 |
| 1999 | 1,443 | 967 | 1,394 | 1,399 | 1,273 | 1,397 | 1,312 | 1,549 | 962 | 1,380 | 1,282 | 1,146 |
| 2000 | 1,265 | 1,366 | 1,096 | 1,167 | 1,231 | 1,351 | 1,398 | 1,413 | 1,114 | 1,203 | 1,075 | 1,438 |
| 2001 | 1,444 | 1,200 | 987 | 1,039 | 1,179 | 1,505 | 1,356 | 1,258 | 1,335 | 1,350 | 1,280 | 1,417 |
| 2002 | 1,478 | 1,289 | 1,457 | 1,445 | 1,415 | 1,103 | 1,000 | 1,038 | 1,516 | 1,267 | 1,353 | 1,540 |
| 2003 | 1,956 | 1,571 | 1,912 | 1,525 | 1,730 | 1,606 | 1,395 | 1,331 | 1,306 | 1,179 | 539 | 1,378 |
| 2004 | 1,598 | 1,599 | 1,534 | 1,501 | 1,489 | 1,348 | 1,337 | 1,409 | 1,281 | 1,445 | 1,531 | 2,082 |
| 2005 | 1,933 | 1,360 | 1,437 | 1,243 | 1,343 | 1,318 | 1,289 | 1,091 | 1,338 | 1,479 | 1,665 | 1,895 |
| 2006 | 1,796 | 1,597 | 1,628 | 1,709 | 1,464 | 1,272 | 1,048 | 1,452 | 1,286 | 852 | 1,465 | 1,530 |
| 2007 | 1,553 | 878 | 448 | 1,325 | 1,123 | 956 | 1,062 | 1,270 | 1,360 | 1,343 | 1,577 | 1,703 |
| 2008 | 1,564 | 1,125 | 1,373 | 1,398 | 852 | 1,282 | 1,499 | 1,298 | 1,758 | 1,283 | 1,405 | 1,680 |
| 2009 | 1,595 | 1,555 | 1,403 | 932 | 1,617 | 1,541 | 2,109 | 1,685 | 1,371 | 1,464 | 1,425 | 1,028 |
| 2010 | 716 | 771 | 851 | 678 | 777 | 780 | 504 | 496 | 708 | 611 | 262 | 374 |
| 2011 | 341 | 258 | 26 | 171 | 159 | 434 | 213 | 378 | 395 | 525 | 792 | 748 |
| 2012 | 599 | 582 | 481 | 377 | 261 | 356 | 65 | 98 | 554 | 1,005 | 537 | 702 |
| 2013 | 562 | 18 | 364 | 569 | 456 | 543 | 555 | 639 | 626 | 639 | 602 | 306 |
| 2014 | 357 | 337 | 490 | 488 | 531 | 701 | 491 | 475 | 237 | 410 | 307 | 571 |
| 2015 | 48 | 208 | 183 | 416 | 521 | 323 | 373 | 239 | 191 | 463 | 190 | 269 |
| 2016 | 175 | 188 | 207 | 321 | 108 | 88 | 95 | 205 | 397 | 138 | 268 | 359 |
| 2017 | 374 | 448 | 346 | 465 | 338 | 326 | 408 | 360 | 212 | 185 | 82 | 162 |
| 2018 | 198 | 373 | 75 | 345 | 477 | 337 | 518 | 560 | 678 | 318 | 463 | 596 |
| 2019 | 359 | 236 | 576 | 503 | 143 | -7 | 34 | 135 | -44 | 26 | -26 | -72 |
| 2020 | -141 | -72 | -107 | -34 | -9 | -6 | -1 | 0 | -9 | -2 | -15 | -28 |
| 2021 | -38 | -32 | -10 | -17 | -5 | 3 | -1 | -2 | -4 | -20 | -6 | -20 |
| 2022 | -27 | -33 | -22 | 8 | 4 | 2 | 5 | 2 | 0 | -11 | -14 | |
| 2023 | -17 | -9 | -23 | -1 | 4 | -2 | 6 | -2 | -6 | 4 | 158 | 365 |
| 2024 | 18 | |||||||||||
| - = No Data Reported; -- = Not Applicable; NA = Not Available; W = Withheld to avoid disclosure of individual company data. |
| Release Date: 3/29/2024 |
| Next Release Date: 4/30/2024 |