|
Download Data (XLS File) |
|
||||||||
|
||||||||
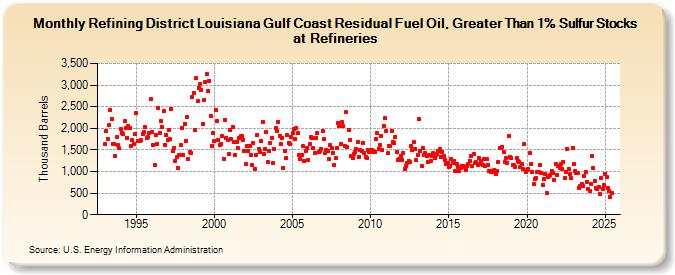
| Refining District Louisiana Gulf Coast Residual Fuel Oil, Greater Than 1% Sulfur Stocks at Refineries (Thousand Barrels) | ||||||||
| Year | Jan | Feb | Mar | Apr | May | Jun | Jul | Aug | Sep | Oct | Nov | Dec |
|---|---|---|---|---|---|---|---|---|---|---|---|---|
| 1993 | 1,635 | 1,928 | 1,760 | 2,077 | 2,430 | 2,223 | 1,637 | 1,642 | 1,369 | 1,802 | 1,605 | 1,537 |
| 1994 | 1,976 | 1,898 | 1,877 | 2,172 | 1,999 | 1,786 | 2,062 | 2,007 | 1,591 | 1,738 | 1,647 | 1,867 |
| 1995 | 2,356 | 1,709 | 1,706 | 1,696 | 1,723 | 1,869 | 1,925 | 2,019 | 1,779 | 1,796 | 1,889 | 2,672 |
| 1996 | 1,921 | 1,624 | 1,149 | 1,846 | 1,644 | 2,480 | 1,901 | 2,166 | 2,029 | 2,402 | 1,623 | 1,851 |
| 1997 | 1,725 | 1,958 | 1,748 | 2,454 | 1,479 | 1,550 | 1,249 | 1,325 | 1,091 | 1,391 | 1,612 | 2,012 |
| 1998 | 1,387 | 2,097 | 1,703 | 2,253 | 1,282 | 1,457 | 1,431 | 2,733 | 2,820 | 1,954 | 3,161 | 2,624 |
| 1999 | 2,940 | 3,019 | 2,884 | 2,104 | 2,657 | 3,072 | 3,245 | 2,861 | 3,104 | 2,292 | 1,595 | 1,893 |
| 2000 | 1,708 | 2,429 | 2,175 | 1,723 | 1,602 | 1,639 | 1,812 | 1,296 | 2,203 | 1,772 | 1,733 | 1,397 |
| 2001 | 1,964 | 1,748 | 2,025 | 1,683 | 1,383 | 1,693 | 1,555 | 1,766 | 1,815 | 1,818 | 1,740 | 1,480 |
| 2002 | 1,167 | 1,596 | 1,474 | 1,593 | 1,374 | 1,160 | 1,654 | 1,068 | 1,386 | 1,850 | 1,524 | 1,452 |
| 2003 | 1,700 | 2,146 | 1,412 | 1,518 | 1,920 | 1,225 | 1,477 | 1,660 | 1,775 | 1,196 | 1,521 | 2,012 |
| 2004 | 1,942 | 2,154 | 1,830 | 1,636 | 1,783 | 1,083 | 1,471 | 1,304 | 1,835 | 1,666 | 1,632 | 1,800 |
| 2005 | 1,891 | 1,981 | 1,757 | 2,012 | 1,887 | 1,380 | 1,285 | 1,383 | 1,584 | 1,252 | 1,477 | 1,550 |
| 2006 | 1,263 | 1,626 | 1,800 | 1,764 | 1,536 | 1,428 | 1,784 | 1,882 | 1,440 | 1,465 | 1,532 | 1,935 |
| 2007 | 1,753 | 1,423 | 1,499 | 1,468 | 1,281 | 1,603 | 1,553 | 1,424 | 1,151 | 1,304 | 1,545 | 2,130 |
| 2008 | 2,047 | 1,633 | 2,145 | 2,048 | 1,589 | 2,373 | 1,556 | 1,960 | 1,732 | 1,369 | 1,320 | 1,405 |
| 2009 | 1,452 | 1,513 | 1,685 | 1,345 | 1,503 | 1,474 | 1,668 | 1,424 | 1,347 | 1,324 | 1,508 | 1,455 |
| 2010 | 1,447 | 1,501 | 1,476 | 1,448 | 1,749 | 1,880 | 1,528 | 1,603 | 1,826 | 1,490 | 2,056 | 2,227 |
| 2011 | 1,944 | 1,418 | 1,599 | 1,580 | 1,940 | 1,690 | 1,658 | 1,809 | 1,448 | 1,258 | 1,300 | 1,370 |
| 2012 | 1,273 | 1,436 | 1,068 | 1,117 | 1,203 | 1,249 | 1,226 | 1,589 | 1,495 | 1,674 | 1,525 | 1,261 |
| 2013 | 1,389 | 2,212 | 1,474 | 1,137 | 1,547 | 1,384 | 1,427 | 1,361 | 1,227 | 1,384 | 1,246 | 1,355 |
| 2014 | 1,417 | 1,314 | 1,378 | 1,410 | 1,465 | 1,510 | 1,335 | 1,451 | 1,355 | 1,261 | 1,169 | 1,197 |
| 2015 | 1,107 | 1,118 | 1,285 | 1,190 | 1,250 | 1,010 | 1,170 | 1,099 | 1,019 | 1,087 | 1,123 | 1,129 |
| 2016 | 1,115 | 1,024 | 1,117 | 1,185 | 1,251 | 1,351 | 1,126 | 1,397 | 1,186 | 1,214 | 1,153 | 1,305 |
| 2017 | 1,166 | 1,243 | 1,155 | 1,285 | 1,130 | 1,283 | 1,159 | 1,007 | 997 | 1,015 | 991 | 1,031 |
| 2018 | 941 | 1,003 | 1,216 | 1,548 | 1,539 | 1,562 | 1,456 | 1,211 | 1,305 | 1,206 | 1,818 | 1,345 |
| 2019 | 1,319 | 1,155 | 1,143 | 1,095 | 1,317 | 1,249 | 1,218 | 1,098 | 1,173 | 1,051 | 1,628 | 995 |
| 2020 | 1,027 | 1,069 | 1,430 | 1,166 | 994 | 701 | 838 | 839 | 983 | 997 | 1,154 | 972 |
| 2021 | 687 | 818 | 943 | 502 | 877 | 896 | 915 | 1,008 | 972 | 811 | 1,183 | 927 |
| 2022 | 1,122 | 1,087 | 1,173 | 1,063 | 1,221 | 857 | 994 | 1,514 | 1,067 | 938 | 839 | 1,555 |
| 2023 | 1,179 | 1,014 | 968 | 974 | 626 | 654 | 707 | 660 | 887 | 985 | 762 | 587 |
| 2024 | 551 | |||||||||||
| - = No Data Reported; -- = Not Applicable; NA = Not Available; W = Withheld to avoid disclosure of individual company data. |
| Release Date: 3/29/2024 |
| Next Release Date: 4/30/2024 |