|
Download Data (XLS File) |
|
||||||||
|
||||||||
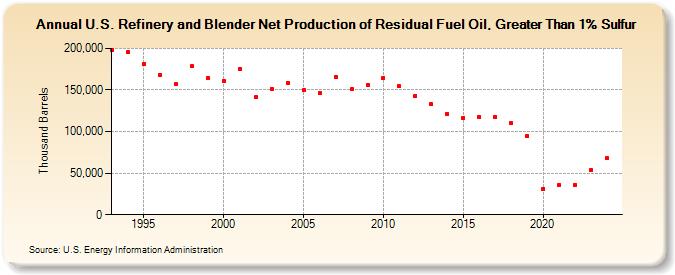
| U.S. Refinery and Blender Net Production of Residual Fuel Oil, Greater Than 1% Sulfur (Thousand Barrels) | ||||||||
| Decade | Year-0 | Year-1 | Year-2 | Year-3 | Year-4 | Year-5 | Year-6 | Year-7 | Year-8 | Year-9 |
|---|---|---|---|---|---|---|---|---|---|---|
| 1990's | 198,100 | 195,089 | 181,150 | 168,021 | 156,866 | 178,667 | 164,364 | |||
| 2000's | 161,275 | 174,904 | 141,011 | 151,721 | 158,669 | 149,582 | 146,580 | 166,186 | 150,800 | 155,736 |
| 2010's | 164,941 | 154,455 | 143,105 | 132,828 | 121,169 | 116,676 | 117,291 | 117,328 | 110,106 | 94,118 |
| 2020's | 31,470 | 35,833 | 36,095 | 53,991 | 68,136 |
| - = No Data Reported; -- = Not Applicable; NA = Not Available; W = Withheld to avoid disclosure of individual company data. |
| Release Date: 6/30/2025 |
| Next Release Date: 8/29/2025 |