|
Download Data (XLS File) |
|
||||||||
|
||||||||
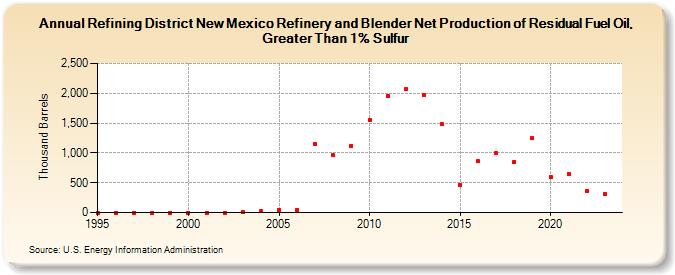
| Refining District New Mexico Refinery and Blender Net Production of Residual Fuel Oil, Greater Than 1% Sulfur (Thousand Barrels) | ||||||||
| Decade | Year-0 | Year-1 | Year-2 | Year-3 | Year-4 | Year-5 | Year-6 | Year-7 | Year-8 | Year-9 |
|---|---|---|---|---|---|---|---|---|---|---|
| 1990's | 0 | 0 | 0 | 0 | 0 | |||||
| 2000's | 0 | 0 | 0 | 11 | 21 | 48 | 50 | 1,145 | 957 | 1,122 |
| 2010's | 1,554 | 1,959 | 2,071 | 1,968 | 1,480 | 469 | 863 | 1,001 | 854 | 1,245 |
| 2020's | 599 | 654 | 369 | 307 |
| - = No Data Reported; -- = Not Applicable; NA = Not Available; W = Withheld to avoid disclosure of individual company data. |
| Release Date: 3/29/2024 |
| Next Release Date: 8/30/2024 |