|
Download Data (XLS File) |
|
||||||||
|
||||||||
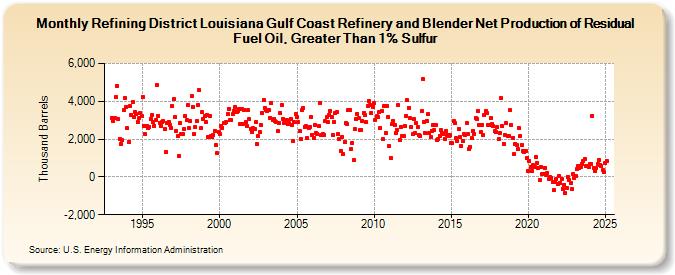
| Refining District Louisiana Gulf Coast Refinery and Blender Net Production of Residual Fuel Oil, Greater Than 1% Sulfur (Thousand Barrels) | ||||||||
| Year | Jan | Feb | Mar | Apr | May | Jun | Jul | Aug | Sep | Oct | Nov | Dec |
|---|---|---|---|---|---|---|---|---|---|---|---|---|
| 1993 | 3,116 | 2,959 | 3,131 | 4,215 | 4,825 | 3,058 | 2,029 | 1,747 | 1,929 | 3,519 | 4,174 | 3,715 |
| 1994 | 2,570 | 1,851 | 3,746 | 3,291 | 3,957 | 3,183 | 3,431 | 3,312 | 2,894 | 3,090 | 3,372 | 3,225 |
| 1995 | 4,249 | 2,670 | 2,272 | 2,714 | 2,567 | 2,651 | 3,069 | 3,254 | 2,904 | 2,707 | 2,998 | 4,861 |
| 1996 | 3,238 | 2,874 | 2,717 | 2,901 | 2,951 | 2,516 | 1,341 | 2,840 | 2,917 | 2,767 | 2,583 | 3,750 |
| 1997 | 4,116 | 3,147 | 2,416 | 2,144 | 1,121 | 2,846 | 2,281 | 2,281 | 2,546 | 3,231 | 2,996 | 3,801 |
| 1998 | 2,579 | 2,949 | 4,262 | 3,713 | 2,269 | 2,651 | 2,953 | 3,815 | 4,590 | 2,563 | 3,417 | 3,074 |
| 1999 | 3,219 | 2,889 | 3,294 | 2,121 | 3,196 | 2,176 | 2,100 | 2,217 | 2,451 | 1,664 | 1,251 | 2,377 |
| 2000 | 2,247 | 2,708 | 2,612 | 2,838 | 2,857 | 2,892 | 3,339 | 3,617 | 3,022 | 2,995 | 3,304 | 3,477 |
| 2001 | 3,676 | 3,426 | 3,496 | 3,577 | 2,808 | 3,617 | 2,792 | 3,552 | 2,904 | 2,708 | 3,518 | 3,037 |
| 2002 | 2,557 | 2,362 | 2,566 | 2,522 | 2,887 | 1,725 | 2,157 | 2,361 | 2,747 | 3,405 | 4,079 | 3,637 |
| 2003 | 3,561 | 3,474 | 3,562 | 3,137 | 3,892 | 3,033 | 3,087 | 2,936 | 2,883 | 2,410 | 2,869 | 3,372 |
| 2004 | 3,807 | 3,064 | 2,872 | 2,995 | 3,000 | 2,790 | 2,829 | 3,052 | 2,770 | 1,899 | 2,883 | 3,310 |
| 2005 | 3,180 | 2,909 | 2,403 | 2,018 | 3,529 | 3,641 | 2,650 | 2,667 | 2,057 | 2,585 | 2,647 | 3,154 |
| 2006 | 2,223 | 2,074 | 2,751 | 2,339 | 2,257 | 2,701 | 3,924 | 2,198 | 2,273 | 2,232 | 2,940 | 3,144 |
| 2007 | 2,911 | 3,278 | 3,484 | 3,149 | 2,213 | 2,913 | 3,376 | 3,413 | 2,267 | 1,996 | 1,388 | 2,129 |
| 2008 | 1,206 | 1,863 | 2,832 | 2,786 | 3,517 | 3,528 | 1,469 | 1,808 | 897 | 2,512 | 3,071 | 3,347 |
| 2009 | 3,100 | 2,460 | 2,469 | 2,935 | 3,393 | 3,285 | 2,893 | 3,756 | 4,001 | 3,819 | 3,404 | 3,720 |
| 2010 | 3,894 | 3,036 | 3,206 | 3,168 | 3,417 | 2,585 | 3,508 | 1,991 | 3,729 | 2,317 | 3,760 | 3,192 |
| 2011 | 1,630 | 1,006 | 2,780 | 2,968 | 2,725 | 2,312 | 2,490 | 3,781 | 1,937 | 2,648 | 2,175 | 2,168 |
| 2012 | 2,716 | 3,227 | 4,047 | 3,663 | 3,090 | 2,643 | 2,252 | 3,055 | 2,318 | 2,848 | 2,639 | 2,210 |
| 2013 | 2,179 | 3,478 | 5,153 | 2,906 | 2,315 | 2,976 | 3,309 | 2,311 | 2,116 | 2,445 | 2,734 | 2,459 |
| 2014 | 2,756 | 1,947 | 1,989 | 2,176 | 2,460 | 2,324 | 2,277 | 2,026 | 2,429 | 2,221 | 2,160 | 2,230 |
| 2015 | 1,814 | 1,772 | 2,942 | 2,849 | 2,040 | 1,908 | 2,549 | 2,093 | 1,654 | 1,893 | 2,254 | 2,230 |
| 2016 | 2,853 | 2,281 | 1,472 | 1,586 | 2,043 | 2,445 | 2,263 | 3,110 | 3,057 | 3,504 | 2,748 | 2,368 |
| 2017 | 2,763 | 2,217 | 3,284 | 3,491 | 3,391 | 2,746 | 2,734 | 3,113 | 2,814 | 2,681 | 2,406 | 2,356 |
| 2018 | 2,629 | 2,008 | 2,305 | 4,149 | 2,669 | 1,758 | 2,209 | 2,826 | 2,187 | 2,187 | 3,518 | 2,744 |
| 2019 | 2,082 | 1,192 | 1,744 | 1,697 | 1,457 | 2,562 | 2,165 | 1,693 | 1,382 | 1,318 | 1,346 | 989 |
| 2020 | 315 | 841 | 537 | 315 | 608 | 506 | 1,027 | 719 | 477 | -190 | 530 | 141 |
| 2021 | 160 | 497 | 125 | 201 | -123 | 3 | -45 | -272 | -695 | -266 | -123 | -393 |
| 2022 | 22 | -315 | -99 | -621 | -403 | -866 | -584 | 17 | -144 | -320 | -641 | 131 |
| 2023 | -41 | 45 | 413 | 592 | 445 | 522 | 709 | 860 | 943 | 571 | 576 | 518 |
| 2024 | 659 | 698 | 3,240 | 493 | 297 | 468 | 659 | 882 | 640 | 562 | 361 | 266 |
| 2025 | 742 | 846 | 470 | 423 | ||||||||
| - = No Data Reported; -- = Not Applicable; NA = Not Available; W = Withheld to avoid disclosure of individual company data. |
| Release Date: 6/30/2025 |
| Next Release Date: 7/31/2025 |