|
Download Data (XLS File) |
|
||||||||
|
||||||||
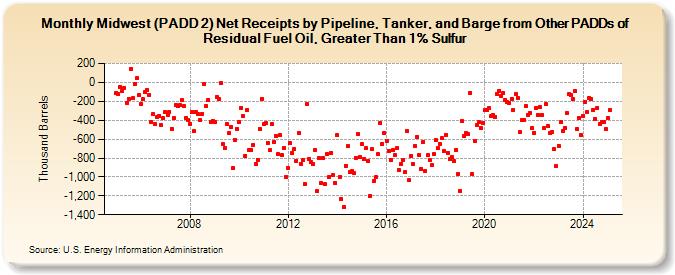
| Midwest (PADD 2) Net Receipts by Pipeline, Tanker, and Barge from Other PADDs of Residual Fuel Oil, Greater Than 1% Sulfur (Thousand Barrels) | ||||||||
| Year | Jan | Feb | Mar | Apr | May | Jun | Jul | Aug | Sep | Oct | Nov | Dec |
|---|---|---|---|---|---|---|---|---|---|---|---|---|
| 2005 | -110 | -125 | -49 | -92 | -59 | -216 | -172 | 146 | -166 | -15 | 43 | -136 |
| 2006 | -230 | -180 | -105 | -76 | -130 | -423 | -336 | -444 | -368 | -354 | -451 | -380 |
| 2007 | -315 | -350 | -310 | -488 | -378 | -237 | -255 | -243 | -183 | -250 | -374 | -396 |
| 2008 | -442 | -312 | -517 | -314 | -335 | -402 | -334 | -12 | -251 | -184 | -424 | -404 |
| 2009 | -416 | -154 | -181 | -9 | -657 | -692 | -444 | -540 | -467 | -908 | -605 | -490 |
| 2010 | -423 | -268 | -357 | -776 | -287 | -715 | -712 | -664 | -865 | -817 | -488 | -172 |
| 2011 | -443 | -434 | -638 | -718 | -445 | -629 | -562 | -761 | -561 | -772 | -695 | -997 |
| 2012 | -901 | -645 | -743 | -704 | -830 | -533 | -863 | -825 | -1,073 | -228 | -812 | -840 |
| 2013 | -863 | -720 | -1,152 | -796 | -1,064 | -800 | -1,080 | -760 | -996 | -742 | -975 | -1,065 |
| 2014 | -560 | -997 | -1,236 | -1,317 | -880 | -676 | -952 | -942 | -961 | -795 | -546 | -790 |
| 2015 | -656 | -809 | -699 | -833 | -1,200 | -708 | -1,039 | -1,003 | -762 | -429 | -651 | -538 |
| 2016 | -616 | -721 | -818 | -719 | -766 | -695 | -928 | -859 | -819 | -946 | -512 | -1,038 |
| 2017 | -775 | -864 | -672 | -575 | -773 | -914 | -629 | -935 | -772 | -824 | -877 | -758 |
| 2018 | -610 | -698 | -651 | -593 | -725 | -554 | -742 | -811 | -790 | -832 | -712 | -964 |
| 2019 | -1,147 | -409 | -572 | -538 | -549 | -110 | -973 | -615 | -453 | -424 | -479 | -431 |
| 2020 | -293 | -290 | -272 | -360 | -341 | -363 | -118 | -88 | -139 | -114 | -188 | -208 |
| 2021 | -217 | -173 | -292 | -128 | -161 | -529 | -398 | -397 | -252 | -345 | -319 | -487 |
| 2022 | -532 | -269 | -345 | -262 | -343 | -484 | -228 | -465 | -534 | -527 | -709 | -888 |
| 2023 | -673 | -421 | -513 | -481 | -279 | -127 | -137 | -179 | -86 | -488 | -375 | -557 |
| 2024 | -352 | |||||||||||
| - = No Data Reported; -- = Not Applicable; NA = Not Available; W = Withheld to avoid disclosure of individual company data. |
| Release Date: 3/29/2024 |
| Next Release Date: 4/30/2024 |