|
Download Data (XLS File) |
|
||||||||
|
||||||||
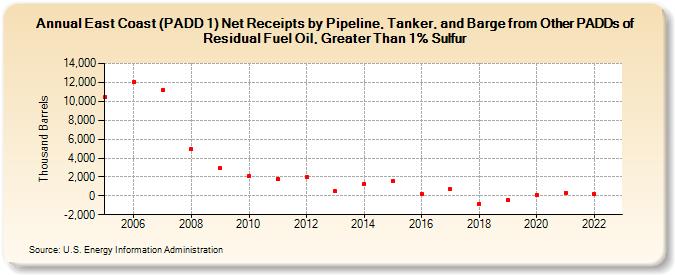
| East Coast (PADD 1) Net Receipts by Pipeline, Tanker, and Barge from Other PADDs of Residual Fuel Oil, Greater Than 1% Sulfur (Thousand Barrels) | ||||||||
| Decade | Year-0 | Year-1 | Year-2 | Year-3 | Year-4 | Year-5 | Year-6 | Year-7 | Year-8 | Year-9 |
|---|---|---|---|---|---|---|---|---|---|---|
| 2000's | 10,429 | 12,088 | 11,182 | 4,918 | 2,935 | |||||
| 2010's | 2,107 | 1,757 | 1,984 | 458 | 1,262 | 1,579 | 199 | 668 | -829 | -468 |
| 2020's | 123 | 349 | 172 |
| - = No Data Reported; -- = Not Applicable; NA = Not Available; W = Withheld to avoid disclosure of individual company data. |
| Release Date: 6/28/2024 |
| Next Release Date: 8/30/2024 |