|
Download Data (XLS File) |
|
||||||||
|
||||||||
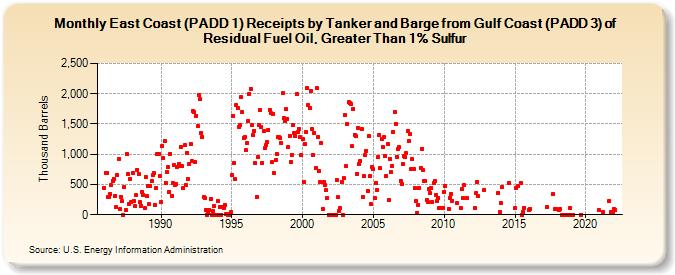
| East Coast (PADD 1) Receipts by Tanker and Barge from Gulf Coast (PADD 3) of Residual Fuel Oil, Greater Than 1% Sulfur (Thousand Barrels) | ||||||||
| Year | Jan | Feb | Mar | Apr | May | Jun | Jul | Aug | Sep | Oct | Nov | Dec |
|---|---|---|---|---|---|---|---|---|---|---|---|---|
| 1986 | 442 | 695 | 688 | 293 | 299 | 345 | 485 | 562 | 598 | 312 | 129 | 652 |
| 1987 | 913 | 88 | 298 | 219 | 0 | 458 | 78 | 1,002 | 672 | 172 | 597 | 217 |
| 1988 | 694 | 227 | 137 | 318 | 745 | 678 | 208 | 150 | 381 | 334 | 103 | 627 |
| 1989 | 302 | 477 | 170 | 474 | 555 | 651 | 692 | 168 | 444 | 1,007 | 1,005 | 633 |
| 1990 | 211 | 1,141 | 938 | 1,213 | 531 | 700 | 783 | 379 | 1,006 | 310 | 522 | 820 |
| 1991 | 498 | 501 | 792 | 841 | 807 | 1,119 | 801 | 447 | 1,152 | 492 | 1,020 | 590 |
| 1992 | 845 | 1,167 | 885 | 1,712 | 1,696 | 877 | 1,629 | 1,459 | 1,982 | 1,916 | 1,350 | 1,285 |
| 1993 | 297 | 282 | 84 | 0 | 29 | 85 | 262 | 0 | 57 | 141 | 0 | 0 |
| 1994 | 223 | 0 | 120 | 0 | 125 | 115 | 167 | 9 | 20 | 0 | 0 | 40 |
| 1995 | 655 | 1,637 | 858 | 584 | 1,809 | 1,763 | 1,450 | 1,478 | 1,949 | 1,698 | 1,271 | 1,282 |
| 1996 | 1,063 | 1,188 | 1,557 | 1,996 | 2,084 | 1,475 | 1,322 | 1,383 | 853 | 299 | 947 | 1,485 |
| 1997 | 1,733 | 1,453 | 859 | 1,379 | 1,096 | 1,148 | 1,199 | 1,401 | 1,733 | 1,678 | 864 | 1,672 |
| 1998 | 686 | 903 | 1,009 | 1,277 | 1,288 | 1,270 | 1,185 | 2,006 | 1,591 | 1,549 | 1,742 | 1,584 |
| 1999 | 1,119 | 1,306 | 878 | 993 | 1,479 | 1,358 | 1,307 | 1,995 | 1,363 | 1,419 | 1,284 | 983 |
| 2000 | 1,245 | 540 | 1,166 | 1,362 | 2,090 | 1,814 | 1,763 | 2,037 | 1,420 | 989 | 1,353 | 769 |
| 2001 | 2,093 | 1,286 | 718 | 541 | 1,183 | 98 | 546 | 488 | 408 | 277 | 0 | 0 |
| 2002 | 0 | 0 | 0 | 0 | 0 | 580 | 286 | 69 | 105 | 549 | 0 | 605 |
| 2003 | 1,646 | 801 | 1,499 | 1,859 | 1,848 | 1,830 | 1,132 | 1,749 | 1,325 | 1,301 | 681 | 1,439 |
| 2004 | 836 | 885 | 1,423 | 301 | 632 | 979 | 1,055 | 389 | 1,301 | 639 | 179 | 792 |
| 2005 | 752 | 269 | 518 | 416 | 954 | 1,322 | 766 | 1,254 | 1,120 | 1,282 | 965 | 647 |
| 2006 | 1,170 | 239 | 929 | 700 | 809 | 1,368 | 1,698 | 1,501 | 959 | 1,088 | 1,113 | 561 |
| 2007 | 504 | 837 | 974 | 950 | 1,012 | 1,378 | 1,215 | 1,329 | 748 | 916 | 754 | 447 |
| 2008 | 232 | 33 | 157 | 438 | 777 | 1,091 | 733 | 553 | 551 | 240 | 210 | 422 |
| 2009 | 358 | 444 | 216 | 523 | 551 | 332 | 224 | 278 | 116 | 118 | 115 | |
| 2010 | 382 | 473 | 101 | 282 | 349 | 230 | 194 | |||||
| 2011 | 115 | 429 | 273 | 490 | 280 | |||||||
| 2012 | 108 | 360 | 546 | 303 | 409 | |||||||
| 2013 | 360 | 53 | ||||||||||
| 2014 | 197 | 457 | 523 | |||||||||
| 2015 | 105 | 436 | 476 | 530 | 0 | 52 | 118 | |||||
| 2016 | 76 | 100 | ||||||||||
| 2017 | 129 | 340 | 100 | 99 | ||||||||
| 2018 | 70 | 94 | 0 | 0 | 0 | 0 | 0 | 0 | 0 | 105 | ||
| 2019 | 0 | 0 | 0 | |||||||||
| 2020 | 70 | |||||||||||
| 2021 | 49 | 228 | 45 | 27 | ||||||||
| 2022 | 92 | 80 | ||||||||||
| - = No Data Reported; -- = Not Applicable; NA = Not Available; W = Withheld to avoid disclosure of individual company data. |
| Release Date: 3/29/2024 |
| Next Release Date: 4/30/2024 |