|
Download Data (XLS File) |
|
||||||||
|
||||||||
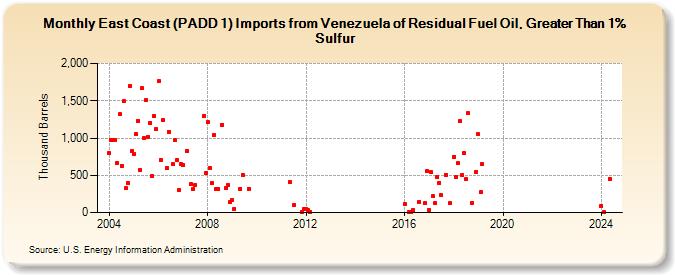
| East Coast (PADD 1) Imports from Venezuela of Residual Fuel Oil, Greater Than 1% Sulfur (Thousand Barrels) | ||||||||
| Year | Jan | Feb | Mar | Apr | May | Jun | Jul | Aug | Sep | Oct | Nov | Dec |
|---|---|---|---|---|---|---|---|---|---|---|---|---|
| 2004 | 793 | 971 | 976 | 969 | 668 | 1,317 | 630 | 1,492 | 324 | 392 | 1,699 | 822 |
| 2005 | 787 | 1,048 | 1,232 | 566 | 1,671 | 1,001 | 1,508 | 1,018 | 1,206 | 487 | 1,297 | 1,120 |
| 2006 | 1,760 | 710 | 1,238 | 593 | 1,085 | 647 | 968 | 703 | 299 | 650 | ||
| 2007 | 636 | 827 | 377 | 320 | 368 | 1,293 | 530 | |||||
| 2008 | 1,215 | 600 | 393 | 1,043 | 314 | 315 | 1,179 | 330 | 369 | 148 | ||
| 2009 | 163 | 48 | 320 | 508 | 321 | |||||||
| 2011 | 408 | 100 | 8 | 45 | ||||||||
| 2012 | 48 | 31 | 8 | |||||||||
| 2016 | 114 | 4 | 8 | 32 | 146 | 122 | 552 | |||||
| 2017 | 35 | 539 | 217 | 131 | 478 | 401 | 231 | 508 | 122 | |||
| 2018 | 750 | 480 | 659 | 1,222 | 501 | 802 | 449 | 1,332 | 130 | 542 | ||
| 2019 | 1,049 | 271 | 647 | |||||||||
| 2024 | 86 | |||||||||||
| - = No Data Reported; -- = Not Applicable; NA = Not Available; W = Withheld to avoid disclosure of individual company data. |
| Release Date: 3/29/2024 |
| Next Release Date: 4/30/2024 |