|
Download Data (XLS File) |
|
||||||||
|
||||||||
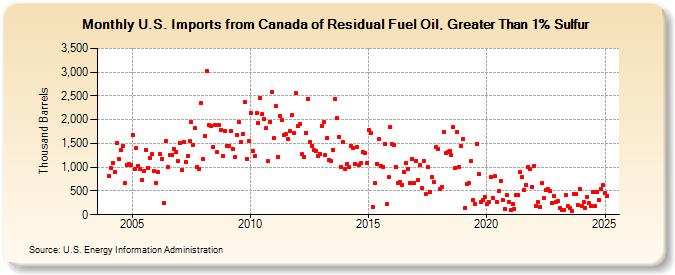
| U.S. Imports from Canada of Residual Fuel Oil, Greater Than 1% Sulfur (Thousand Barrels) | ||||||||
| Year | Jan | Feb | Mar | Apr | May | Jun | Jul | Aug | Sep | Oct | Nov | Dec |
|---|---|---|---|---|---|---|---|---|---|---|---|---|
| 2004 | 823 | 978 | 1,098 | 904 | 1,510 | 1,178 | 1,363 | 1,440 | 661 | 1,050 | 1,068 | 1,042 |
| 2005 | 1,680 | 969 | 1,398 | 1,025 | 957 | 727 | 926 | 1,369 | 989 | 1,185 | 1,269 | 920 |
| 2006 | 668 | 909 | 1,269 | 1,181 | 252 | 1,545 | 996 | 1,255 | 1,261 | 1,378 | 1,317 | 1,135 |
| 2007 | 1,509 | 943 | 1,529 | 1,113 | 1,243 | 1,544 | 1,952 | 1,463 | 1,816 | 1,008 | 963 | 2,351 |
| 2008 | 1,178 | 1,650 | 3,024 | 1,884 | 1,864 | 1,419 | 1,897 | 1,321 | 1,887 | 1,786 | 1,234 | 1,754 |
| 2009 | 1,454 | 1,455 | 1,771 | 1,381 | 1,207 | 1,684 | 1,946 | 1,534 | 1,708 | 2,365 | 1,176 | 1,554 |
| 2010 | 2,137 | 1,344 | 1,243 | 2,139 | 1,933 | 2,462 | 2,117 | 2,012 | 1,818 | 1,135 | 1,960 | 2,589 |
| 2011 | 1,609 | 2,279 | 1,224 | 2,082 | 1,984 | 1,680 | 1,698 | 1,585 | 1,756 | 2,092 | 1,715 | 2,563 |
| 2012 | 1,858 | 1,917 | 1,272 | 1,212 | 1,726 | 2,445 | 1,534 | 1,451 | 1,354 | 1,342 | 1,242 | 1,285 |
| 2013 | 1,874 | 1,943 | 1,249 | 1,615 | 1,154 | 1,123 | 1,369 | 2,442 | 2,030 | 1,641 | 1,001 | 1,522 |
| 2014 | 961 | 1,077 | 1,005 | 1,450 | 1,414 | 1,070 | 1,423 | 1,044 | 1,089 | 1,322 | 1,303 | 1,084 |
| 2015 | 1,774 | 1,715 | 168 | 667 | 1,070 | 1,586 | 1,034 | 1,007 | 1,496 | 216 | 785 | 1,853 |
| 2016 | 1,486 | 1,458 | 1,000 | 673 | 686 | 625 | 894 | 1,089 | 964 | 670 | 1,182 | 676 |
| 2017 | 1,138 | 720 | 1,038 | 556 | 1,140 | 431 | 1,000 | 477 | 799 | 679 | 1,416 | 1,375 |
| 2018 | 534 | 580 | 1,737 | 1,293 | 1,314 | 1,344 | 1,249 | 1,846 | 989 | 1,738 | 1,012 | 1,440 |
| 2019 | 1,594 | 146 | 647 | 669 | 1,139 | 305 | 224 | 1,492 | 853 | 275 | 301 | 366 |
| 2020 | 222 | 277 | 801 | 354 | 814 | 269 | 509 | 717 | 305 | 119 | 407 | 258 |
| 2021 | 102 | 224 | 127 | 408 | 410 | 892 | 791 | 525 | 625 | 1,003 | 957 | 580 |
| 2022 | 1,026 | 188 | 265 | 158 | 667 | 344 | 520 | 538 | 496 | 243 | 401 | 276 |
| 2023 | 283 | 132 | 105 | 108 | 406 | 189 | 151 | 81 | 461 | 383 | 197 | 550 |
| 2024 | 179 | |||||||||||
| - = No Data Reported; -- = Not Applicable; NA = Not Available; W = Withheld to avoid disclosure of individual company data. |
| Release Date: 3/29/2024 |
| Next Release Date: 4/30/2024 |