|
Download Data (XLS File) |
|
||||||||
|
||||||||
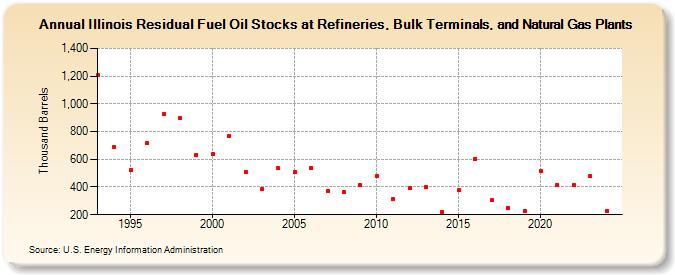
| Illinois Residual Fuel Oil Stocks at Refineries, Bulk Terminals, and Natural Gas Plants (Thousand Barrels) | ||||||||
| Decade | Year-0 | Year-1 | Year-2 | Year-3 | Year-4 | Year-5 | Year-6 | Year-7 | Year-8 | Year-9 |
|---|---|---|---|---|---|---|---|---|---|---|
| 1990's | 1,205 | 692 | 520 | 714 | 930 | 895 | 633 | |||
| 2000's | 635 | 767 | 509 | 386 | 534 | 508 | 536 | 369 | 361 | 414 |
| 2010's | 482 | 310 | 395 | 403 | 220 | 376 | 605 | 304 | 246 | 230 |
| 2020's | 514 | 413 | 415 | 480 |
| - = No Data Reported; -- = Not Applicable; NA = Not Available; W = Withheld to avoid disclosure of individual company data. |
| Release Date: 3/29/2024 |
| Next Release Date: 8/30/2024 |