|
Download Data (XLS File) |
|
||||||||
|
||||||||
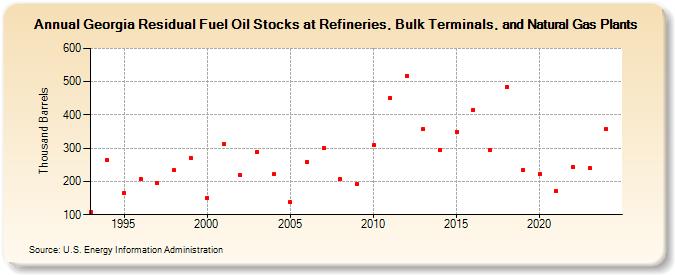
| Georgia Residual Fuel Oil Stocks at Refineries, Bulk Terminals, and Natural Gas Plants (Thousand Barrels) | ||||||||
| Decade | Year-0 | Year-1 | Year-2 | Year-3 | Year-4 | Year-5 | Year-6 | Year-7 | Year-8 | Year-9 |
|---|---|---|---|---|---|---|---|---|---|---|
| 1990's | 108 | 264 | 165 | 208 | 195 | 233 | 271 | |||
| 2000's | 151 | 312 | 218 | 289 | 221 | 137 | 258 | 300 | 207 | 191 |
| 2010's | 309 | 452 | 518 | 357 | 294 | 349 | 415 | 296 | 485 | 235 |
| 2020's | 222 | 172 | 244 | 240 |
| - = No Data Reported; -- = Not Applicable; NA = Not Available; W = Withheld to avoid disclosure of individual company data. |
| Release Date: 3/29/2024 |
| Next Release Date: 8/30/2024 |