|
Download Data (XLS File) |
|
||||||||
|
||||||||
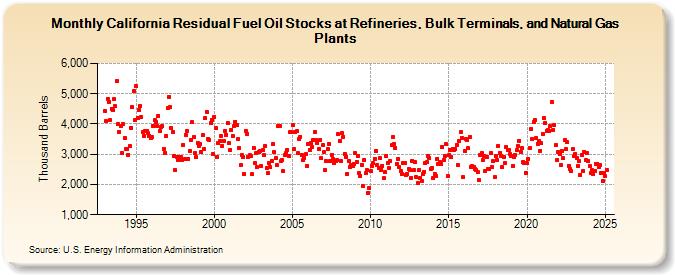
| California Residual Fuel Oil Stocks at Refineries, Bulk Terminals, and Natural Gas Plants (Thousand Barrels) | ||||||||
| Year | Jan | Feb | Mar | Apr | May | Jun | Jul | Aug | Sep | Oct | Nov | Dec |
|---|---|---|---|---|---|---|---|---|---|---|---|---|
| 1993 | 4,441 | 4,085 | 4,841 | 4,736 | 4,120 | 4,507 | 4,453 | 4,817 | 4,578 | 5,416 | 3,993 | 3,734 |
| 1994 | 3,944 | 3,046 | 3,992 | 3,547 | 3,165 | 3,166 | 2,975 | 3,271 | 3,883 | 4,553 | 5,088 | 4,115 |
| 1995 | 5,246 | 4,182 | 4,473 | 4,591 | 4,225 | 3,730 | 3,616 | 3,781 | 3,753 | 3,691 | 3,614 | 3,529 |
| 1996 | 3,570 | 3,935 | 4,115 | 4,081 | 3,939 | 4,278 | 3,768 | 3,908 | 3,925 | 3,178 | 3,049 | 3,603 |
| 1997 | 4,512 | 4,894 | 4,550 | 3,858 | 3,735 | 2,949 | 2,477 | 2,892 | 2,823 | 2,923 | 2,906 | 2,821 |
| 1998 | 3,308 | 2,850 | 3,643 | 3,763 | 2,847 | 3,107 | 3,457 | 4,055 | 3,564 | 3,031 | 2,909 | 3,367 |
| 1999 | 3,282 | 3,339 | 3,081 | 3,627 | 3,169 | 4,197 | 4,412 | 3,517 | 3,471 | 4,023 | 4,147 | 3,009 |
| 2000 | 4,239 | 3,856 | 2,924 | 3,358 | 3,428 | 3,606 | 3,287 | 3,449 | 3,772 | 3,650 | 4,039 | 3,362 |
| 2001 | 3,140 | 3,807 | 3,611 | 3,938 | 4,077 | 3,959 | 3,502 | 3,205 | 2,634 | 2,976 | 2,893 | 2,341 |
| 2002 | 3,782 | 3,680 | 2,921 | 2,965 | 2,937 | 2,336 | 3,216 | 2,711 | 3,037 | 2,569 | 3,074 | 3,106 |
| 2003 | 2,611 | 3,139 | 2,958 | 3,275 | 2,532 | 2,385 | 2,700 | 2,566 | 2,782 | 3,338 | 3,058 | 2,868 |
| 2004 | 2,644 | 3,918 | 3,918 | 2,770 | 2,799 | 2,437 | 2,972 | 3,036 | 3,150 | 2,955 | 3,719 | 3,731 |
| 2005 | 3,957 | 3,168 | 3,726 | 3,753 | 3,026 | 3,504 | 3,570 | 2,979 | 2,798 | 2,881 | 2,997 | 2,624 |
| 2006 | 3,332 | 3,144 | 3,363 | 3,246 | 3,458 | 3,740 | 3,460 | 3,372 | 3,174 | 3,475 | 2,863 | 3,295 |
| 2007 | 3,070 | 2,476 | 2,763 | 3,157 | 3,352 | 2,779 | 2,983 | 2,838 | 2,708 | 2,792 | 2,804 | 3,654 |
| 2008 | 3,438 | 2,780 | 3,686 | 3,579 | 3,020 | 2,924 | 2,348 | 2,777 | 2,578 | 2,652 | 2,606 | 2,686 |
| 2009 | 3,026 | 2,754 | 2,945 | 2,369 | 2,281 | 2,652 | 1,944 | 2,815 | 2,369 | 2,470 | 1,731 | 1,881 |
| 2010 | 2,451 | 2,614 | 2,698 | 2,854 | 3,112 | 2,638 | 2,546 | 2,862 | 2,493 | 2,621 | 2,212 | 2,400 |
| 2011 | 2,940 | 2,721 | 2,540 | 2,766 | 3,292 | 3,575 | 3,347 | 3,207 | 2,688 | 2,846 | 2,580 | 2,451 |
| 2012 | 2,353 | 2,723 | 2,704 | 2,301 | 2,356 | 2,500 | 2,462 | 2,225 | 2,785 | 2,462 | 2,728 | 2,244 |
| 2013 | 2,035 | 2,463 | 2,219 | 2,121 | 2,348 | 2,421 | 2,706 | 2,729 | 2,954 | 2,882 | 2,522 | 2,545 |
| 2014 | 2,209 | 2,361 | 2,267 | 2,851 | 2,680 | 2,743 | 2,681 | 3,243 | 2,820 | 2,932 | 3,333 | 2,267 |
| 2015 | 2,959 | 3,149 | 2,921 | 3,181 | 3,155 | 3,178 | 3,310 | 2,641 | 3,442 | 3,721 | 3,551 | 2,232 |
| 2016 | 3,107 | 3,514 | 3,460 | 3,197 | 3,583 | 2,571 | 2,604 | 2,568 | 2,526 | 2,472 | 2,403 | 2,135 |
| 2017 | 2,961 | 3,024 | 2,798 | 2,940 | 2,451 | 2,912 | 2,502 | 2,514 | 3,031 | 2,573 | 2,761 | 2,238 |
| 2018 | 2,925 | 2,822 | 3,277 | 3,042 | 2,951 | 2,567 | 2,913 | 2,707 | 3,233 | 3,130 | 3,147 | 3,004 |
| 2019 | 2,953 | 2,623 | 2,901 | 2,990 | 3,139 | 3,269 | 3,453 | 3,078 | 3,202 | 2,749 | 2,723 | 2,392 |
| 2020 | 2,698 | 2,836 | 3,196 | 3,826 | 3,492 | 4,069 | 4,127 | 3,530 | 3,348 | 3,446 | 3,122 | 3,355 |
| 2021 | 3,674 | 4,195 | 4,017 | 3,779 | 3,799 | 3,766 | 3,932 | 4,727 | 3,804 | 3,974 | 3,298 | 2,817 |
| 2022 | 3,076 | 3,019 | 2,649 | 3,105 | 2,866 | 3,456 | 3,162 | 3,392 | 2,627 | 2,524 | 2,435 | 3,171 |
| 2023 | 2,927 | 3,022 | 2,872 | 2,595 | 2,773 | 2,328 | 2,975 | 2,452 | 2,870 | 2,797 | 3,030 | 2,780 |
| 2024 | 2,600 | |||||||||||
| - = No Data Reported; -- = Not Applicable; NA = Not Available; W = Withheld to avoid disclosure of individual company data. |
| Release Date: 3/29/2024 |
| Next Release Date: 4/30/2024 |