|
Download Data (XLS File) |
|
||||||||
|
||||||||
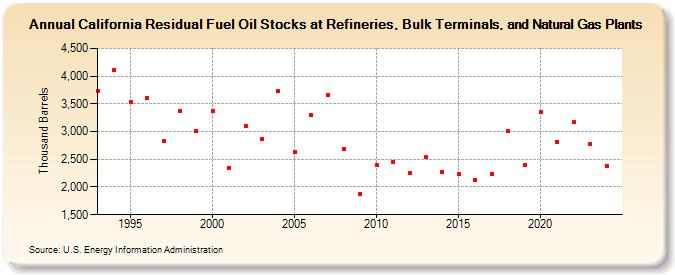
| California Residual Fuel Oil Stocks at Refineries, Bulk Terminals, and Natural Gas Plants (Thousand Barrels) | ||||||||
| Decade | Year-0 | Year-1 | Year-2 | Year-3 | Year-4 | Year-5 | Year-6 | Year-7 | Year-8 | Year-9 |
|---|---|---|---|---|---|---|---|---|---|---|
| 1990's | 3,734 | 4,115 | 3,529 | 3,603 | 2,821 | 3,367 | 3,009 | |||
| 2000's | 3,362 | 2,341 | 3,106 | 2,868 | 3,731 | 2,624 | 3,295 | 3,654 | 2,686 | 1,881 |
| 2010's | 2,400 | 2,451 | 2,244 | 2,545 | 2,267 | 2,232 | 2,135 | 2,238 | 3,004 | 2,392 |
| 2020's | 3,355 | 2,817 | 3,171 | 2,780 |
| - = No Data Reported; -- = Not Applicable; NA = Not Available; W = Withheld to avoid disclosure of individual company data. |
| Release Date: 3/29/2024 |
| Next Release Date: 8/30/2024 |