|
Download Data (XLS File) |
|
||||||||
|
||||||||
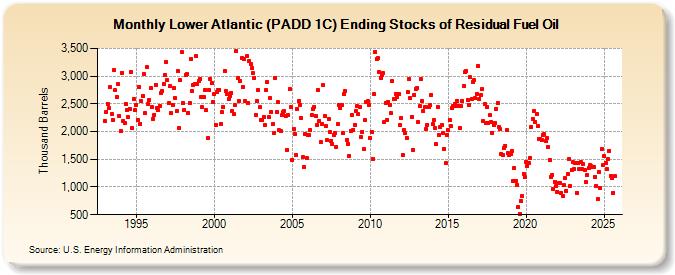
| Lower Atlantic (PADD 1C) Ending Stocks of Residual Fuel Oil (Thousand Barrels) | ||||||||
| Year | Jan | Feb | Mar | Apr | May | Jun | Jul | Aug | Sep | Oct | Nov | Dec |
|---|---|---|---|---|---|---|---|---|---|---|---|---|
| 1993 | 2,198 | 2,358 | 2,504 | 2,422 | 2,801 | 2,320 | 2,213 | 3,106 | 2,741 | 2,631 | 2,853 | 2,287 |
| 1994 | 2,012 | 3,062 | 2,191 | 2,157 | 2,504 | 2,385 | 2,254 | 2,413 | 3,072 | 2,063 | 2,588 | 2,384 |
| 1995 | 2,487 | 2,212 | 2,807 | 2,136 | 2,550 | 2,649 | 3,040 | 2,327 | 3,163 | 2,503 | 2,564 | 2,780 |
| 1996 | 2,443 | 2,231 | 2,305 | 2,843 | 2,416 | 2,383 | 2,466 | 2,695 | 2,731 | 2,857 | 3,026 | 3,262 |
| 1997 | 2,927 | 2,508 | 2,817 | 2,327 | 2,486 | 2,784 | 2,601 | 2,368 | 3,085 | 2,062 | 2,924 | 3,432 |
| 1998 | 2,511 | 2,394 | 3,022 | 3,035 | 2,341 | 2,510 | 3,314 | 2,732 | 2,840 | 2,853 | 3,360 | 2,855 |
| 1999 | 2,920 | 2,954 | 2,616 | 2,439 | 2,627 | 2,754 | 2,382 | 1,880 | 2,758 | 2,948 | 2,879 | 2,531 |
| 2000 | 2,677 | 2,125 | 2,711 | 2,754 | 2,757 | 2,144 | 2,347 | 2,451 | 3,095 | 2,735 | 2,682 | 2,590 |
| 2001 | 2,639 | 2,701 | 2,363 | 2,308 | 2,475 | 3,453 | 2,959 | 2,549 | 2,912 | 3,330 | 2,803 | 3,313 |
| 2002 | 2,543 | 3,355 | 2,516 | 3,279 | 3,222 | 3,144 | 3,056 | 2,966 | 2,297 | 2,551 | 2,745 | 2,435 |
| 2003 | 2,208 | 2,209 | 2,265 | 2,113 | 2,750 | 2,896 | 2,261 | 2,609 | 2,352 | 2,137 | 1,981 | 2,973 |
| 2004 | 2,360 | 2,528 | 2,021 | 2,018 | 2,292 | 2,347 | 2,365 | 2,285 | 1,670 | 2,302 | 2,763 | 2,437 |
| 2005 | 1,492 | 2,048 | 1,960 | 1,577 | 2,404 | 2,547 | 2,486 | 2,247 | 1,536 | 1,357 | 1,961 | 1,522 |
| 2006 | 1,934 | 1,929 | 2,025 | 2,297 | 2,399 | 2,449 | 2,282 | 2,118 | 2,746 | 2,192 | 1,809 | 2,144 |
| 2007 | 2,835 | 2,279 | 2,094 | 1,839 | 2,227 | 1,991 | 1,838 | 1,770 | 1,938 | 1,970 | 1,725 | 2,129 |
| 2008 | 2,486 | 2,432 | 2,470 | 1,970 | 2,672 | 2,730 | 1,844 | 1,784 | 1,565 | 2,018 | 2,302 | 2,036 |
| 2009 | 2,125 | 2,367 | 2,453 | 2,309 | 2,448 | 1,906 | 1,995 | 1,685 | 2,208 | 2,527 | 2,543 | 2,486 |
| 2010 | 1,887 | 1,992 | 1,503 | 2,671 | 3,441 | 3,317 | 3,322 | 3,072 | 2,962 | 3,018 | 3,054 | 2,176 |
| 2011 | 2,521 | 2,213 | 2,541 | 2,485 | 2,329 | 2,906 | 2,584 | 2,590 | 2,685 | 2,622 | 2,685 | 2,125 |
| 2012 | 2,245 | 1,581 | 2,032 | 1,972 | 1,885 | 2,713 | 2,945 | 2,604 | 2,271 | 1,672 | 2,667 | 2,766 |
| 2013 | 2,790 | 2,174 | 2,457 | 2,941 | 2,548 | 2,368 | 2,441 | 2,044 | 2,120 | 2,444 | 2,471 | 2,666 |
| 2014 | 2,128 | 2,212 | 2,057 | 1,769 | 2,450 | 1,938 | 2,082 | 2,115 | 1,982 | 1,690 | 1,429 | 1,945 |
| 2015 | 2,031 | 2,211 | 2,100 | 2,420 | 2,463 | 2,502 | 2,462 | 2,556 | 2,466 | 2,063 | 2,455 | 2,547 |
| 2016 | 2,826 | 3,074 | 3,096 | 2,572 | 2,484 | 2,977 | 2,590 | 2,894 | 2,922 | 2,602 | 2,674 | 3,188 |
| 2017 | 2,589 | 2,659 | 2,767 | 2,189 | 2,490 | 2,159 | 2,444 | 2,157 | 2,298 | 2,171 | 1,981 | 2,121 |
| 2018 | 2,151 | 2,415 | 2,514 | 2,091 | 2,050 | 1,598 | 1,584 | 1,706 | 1,741 | 2,023 | 1,609 | 1,569 |
| 2019 | 1,603 | 1,644 | 1,108 | 1,345 | 1,106 | 1,038 | 638 | 513 | 752 | 845 | 1,243 | 1,176 |
| 2020 | 1,458 | 1,375 | 1,426 | 1,531 | 2,086 | 2,234 | 2,369 | 2,176 | 2,312 | 2,098 | 1,862 | 1,868 |
| 2021 | 1,849 | 1,936 | 1,953 | 1,821 | 1,881 | 1,726 | 1,492 | 1,185 | 1,217 | 966 | 1,095 | 1,009 |
| 2022 | 918 | 1,076 | 1,071 | 899 | 836 | 1,031 | 1,157 | 928 | 1,243 | 1,507 | 1,014 | 1,307 |
| 2023 | 1,445 | 1,326 | 1,432 | 898 | 1,425 | 1,322 | 1,442 | 1,326 | 1,412 | 1,303 | 1,093 | 1,219 |
| 2024 | 1,345 | |||||||||||
| - = No Data Reported; -- = Not Applicable; NA = Not Available; W = Withheld to avoid disclosure of individual company data. |
| Release Date: 3/29/2024 |
| Next Release Date: 4/30/2024 |