|
Download Data (XLS File) |
|
||||||||
|
||||||||
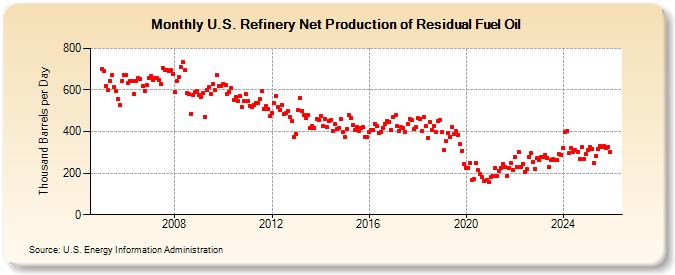
| U.S. Refinery Net Production of Residual Fuel Oil (Thousand Barrels per Day) | ||||||||
| Year | Jan | Feb | Mar | Apr | May | Jun | Jul | Aug | Sep | Oct | Nov | Dec |
|---|---|---|---|---|---|---|---|---|---|---|---|---|
| 2005 | 701 | 691 | 619 | 598 | 645 | 673 | 614 | 594 | 555 | 530 | 642 | 674 |
| 2006 | 670 | 635 | 644 | 643 | 580 | 645 | 658 | 652 | 619 | 597 | 624 | 656 |
| 2007 | 667 | 650 | 656 | 658 | 647 | 628 | 708 | 698 | 698 | 689 | 694 | 676 |
| 2008 | 588 | 643 | 662 | 710 | 734 | 695 | 584 | 579 | 485 | 575 | 588 | 597 |
| 2009 | 574 | 564 | 584 | 472 | 599 | 614 | 581 | 630 | 599 | 671 | 621 | 618 |
| 2010 | 630 | 624 | 582 | 589 | 609 | 553 | 567 | 546 | 571 | 519 | 545 | 582 |
| 2011 | 546 | 525 | 517 | 528 | 535 | 539 | 555 | 593 | 509 | 525 | 509 | 477 |
| 2012 | 487 | 536 | 571 | 520 | 504 | 530 | 486 | 487 | 497 | 471 | 450 | 375 |
| 2013 | 388 | 502 | 562 | 501 | 479 | 466 | 478 | 415 | 429 | 418 | 461 | 454 |
| 2014 | 476 | 428 | 460 | 422 | 452 | 454 | 401 | 435 | 412 | 416 | 461 | 397 |
| 2015 | 376 | 414 | 480 | 466 | 432 | 408 | 420 | 401 | 418 | 420 | 373 | 373 |
| 2016 | 398 | 408 | 408 | 438 | 427 | 395 | 400 | 419 | 437 | 452 | 448 | 408 |
| 2017 | 472 | 481 | 425 | 405 | 420 | 415 | 398 | 437 | 462 | 455 | 410 | 422 |
| 2018 | 463 | 459 | 404 | 469 | 426 | 368 | 447 | 407 | 427 | 398 | 449 | 456 |
| 2019 | 397 | 310 | 353 | 395 | 376 | 420 | 390 | 401 | 384 | 338 | 308 | 242 |
| 2020 | 226 | 224 | 251 | 168 | 172 | 249 | 213 | 194 | 182 | 163 | 166 | 159 |
| 2021 | 180 | 188 | 223 | 186 | 211 | 226 | 245 | 229 | 186 | 227 | 248 | 213 |
| 2022 | 277 | 229 | 302 | 231 | 244 | 205 | 218 | 277 | 296 | 255 | 220 | 273 |
| 2023 | 262 | 277 | 277 | 288 | 275 | 230 | 264 | 270 | 264 | 263 | 291 | 289 |
| 2024 | 321 | 399 | ||||||||||
| - = No Data Reported; -- = Not Applicable; NA = Not Available; W = Withheld to avoid disclosure of individual company data. |
| Release Date: 4/30/2024 |
| Next Release Date: 5/31/2024 |
Referring Pages: