|
Download Data (XLS File) |
|
||||||||
|
||||||||
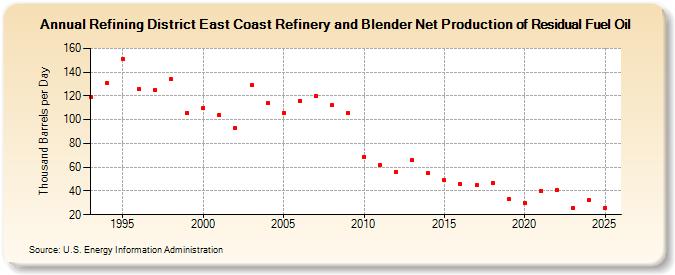
| Refining District East Coast Refinery and Blender Net Production of Residual Fuel Oil (Thousand Barrels per Day) | ||||||||
| Decade | Year-0 | Year-1 | Year-2 | Year-3 | Year-4 | Year-5 | Year-6 | Year-7 | Year-8 | Year-9 |
|---|---|---|---|---|---|---|---|---|---|---|
| 1990's | 119 | 131 | 151 | 126 | 125 | 134 | 106 | |||
| 2000's | 110 | 104 | 93 | 129 | 114 | 106 | 116 | 120 | 112 | 106 |
| 2010's | 69 | 62 | 56 | 66 | 55 | 49 | 46 | 45 | 47 | 33 |
| 2020's | 30 | 40 | 41 | 26 |
| - = No Data Reported; -- = Not Applicable; NA = Not Available; W = Withheld to avoid disclosure of individual company data. |
| Release Date: 3/29/2024 |
| Next Release Date: 8/30/2024 |