|
Download Data (XLS File) |
|
||||||||
|
||||||||
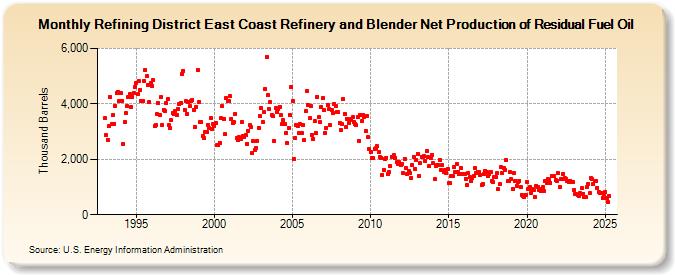
| Refining District East Coast Refinery and Blender Net Production of Residual Fuel Oil (Thousand Barrels) | ||||||||
| Year | Jan | Feb | Mar | Apr | May | Jun | Jul | Aug | Sep | Oct | Nov | Dec |
|---|---|---|---|---|---|---|---|---|---|---|---|---|
| 1993 | 3,473 | 2,862 | 2,696 | 3,190 | 4,261 | 3,255 | 3,598 | 3,287 | 3,919 | 4,387 | 4,439 | 4,088 |
| 1994 | 4,375 | 4,112 | 2,558 | 3,341 | 3,656 | 3,912 | 4,243 | 4,348 | 3,890 | 4,248 | 4,397 | 4,624 |
| 1995 | 4,744 | 4,338 | 4,817 | 4,494 | 4,103 | 4,115 | 4,815 | 5,230 | 4,989 | 4,671 | 4,054 | 4,754 |
| 1996 | 4,641 | 4,848 | 3,196 | 3,230 | 3,620 | 4,016 | 3,584 | 4,232 | 3,253 | 3,780 | 3,730 | 4,036 |
| 1997 | 4,165 | 3,219 | 3,124 | 3,404 | 3,670 | 3,648 | 3,744 | 3,612 | 3,829 | 3,980 | 4,017 | 5,082 |
| 1998 | 5,200 | 3,791 | 4,085 | 3,647 | 4,057 | 3,912 | 4,088 | 4,137 | 3,795 | 3,170 | 3,897 | 5,223 |
| 1999 | 4,067 | 3,334 | 3,343 | 2,854 | 2,762 | 2,977 | 2,985 | 3,248 | 3,115 | 3,485 | 3,109 | 3,277 |
| 2000 | 3,212 | 3,300 | 2,509 | 2,513 | 2,605 | 3,472 | 3,911 | 3,456 | 2,895 | 4,202 | 4,087 | 4,090 |
| 2001 | 4,271 | 3,466 | 3,311 | 3,330 | 3,647 | 2,759 | 2,687 | 2,791 | 2,742 | 3,358 | 2,845 | 2,791 |
| 2002 | 2,884 | 2,569 | 3,037 | 3,221 | 3,159 | 2,232 | 2,665 | 2,346 | 2,411 | 2,663 | 3,139 | 3,568 |
| 2003 | 3,858 | 3,344 | 3,693 | 4,549 | 5,687 | 4,315 | 3,818 | 4,062 | 3,581 | 3,556 | 2,664 | 3,840 |
| 2004 | 3,700 | 3,829 | 3,903 | 3,594 | 3,279 | 3,407 | 3,259 | 2,958 | 2,594 | 3,128 | 3,591 | 4,620 |
| 2005 | 4,104 | 2,013 | 2,775 | 3,233 | 3,212 | 2,935 | 3,272 | 2,954 | 3,224 | 2,695 | 3,729 | 4,478 |
| 2006 | 3,952 | 3,472 | 3,934 | 2,889 | 2,734 | 3,388 | 2,944 | 4,258 | 3,508 | 3,327 | 3,892 | 4,207 |
| 2007 | 3,760 | 2,962 | 3,142 | 3,968 | 3,800 | 3,228 | 3,773 | 3,668 | 4,007 | 3,905 | 3,714 | 3,691 |
| 2008 | 3,317 | 3,060 | 3,262 | 4,165 | 3,651 | 3,156 | 3,464 | 3,309 | 3,431 | 3,450 | 3,510 | 3,352 |
| 2009 | 3,283 | 3,225 | 3,527 | 2,671 | 3,583 | 3,388 | 3,608 | 3,512 | 3,015 | 3,565 | 2,812 | 2,355 |
| 2010 | 2,251 | 2,053 | 2,043 | 2,387 | 2,391 | 2,461 | 2,264 | 2,082 | 2,062 | 1,435 | 1,622 | 2,025 |
| 2011 | 2,055 | 1,474 | 1,533 | 1,748 | 2,092 | 2,085 | 2,141 | 2,052 | 1,890 | 1,838 | 1,894 | 1,778 |
| 2012 | 1,834 | 1,501 | 2,013 | 1,690 | 1,486 | 1,587 | 1,498 | 1,328 | 1,796 | 2,097 | 1,652 | 1,978 |
| 2013 | 2,202 | 1,406 | 1,853 | 2,091 | 2,073 | 2,106 | 1,920 | 2,305 | 2,066 | 1,765 | 2,060 | 2,158 |
| 2014 | 1,848 | 1,281 | 1,754 | 1,796 | 1,790 | 1,988 | 1,614 | 1,784 | 1,524 | 1,619 | 1,499 | 1,657 |
| 2015 | 1,136 | 1,151 | 1,412 | 1,410 | 1,731 | 1,546 | 1,828 | 1,545 | 1,461 | 1,697 | 1,470 | 1,471 |
| 2016 | 1,470 | 1,303 | 1,072 | 1,510 | 1,359 | 1,202 | 1,310 | 1,400 | 1,682 | 1,512 | 1,543 | 1,547 |
| 2017 | 1,434 | 1,075 | 1,104 | 1,460 | 1,571 | 1,553 | 1,389 | 1,469 | 1,532 | 1,217 | 1,166 | 1,360 |
| 2018 | 1,353 | 1,504 | 913 | 1,091 | 1,707 | 1,515 | 1,678 | 1,613 | 1,957 | 1,214 | 1,207 | 1,523 |
| 2019 | 1,272 | 933 | 1,511 | 1,230 | 1,048 | 1,173 | 1,232 | 997 | 729 | 661 | 642 | 727 |
| 2020 | 1,198 | 940 | 1,014 | 769 | 926 | 876 | 653 | 1,048 | 1,017 | 905 | 937 | 853 |
| 2021 | 985 | 849 | 1,227 | 1,161 | 1,292 | 1,264 | 1,148 | 1,396 | 1,385 | 1,391 | 1,256 | 1,208 |
| 2022 | 1,487 | 984 | 1,287 | 1,272 | 1,469 | 1,330 | 1,294 | 1,200 | 1,163 | 1,229 | 1,175 | 1,170 |
| 2023 | 888 | 739 | 750 | 728 | 673 | 766 | 949 | 759 | 646 | 627 | 996 | 1,105 |
| 2024 | 772 | |||||||||||
| - = No Data Reported; -- = Not Applicable; NA = Not Available; W = Withheld to avoid disclosure of individual company data. |
| Release Date: 3/29/2024 |
| Next Release Date: 4/30/2024 |