|
Download Data (XLS File) |
|
||||||||
|
||||||||
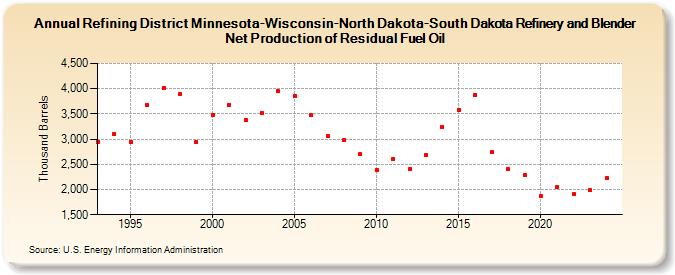
| Refining District Minnesota-Wisconsin-North Dakota-South Dakota Refinery and Blender Net Production of Residual Fuel Oil (Thousand Barrels) | ||||||||
| Decade | Year-0 | Year-1 | Year-2 | Year-3 | Year-4 | Year-5 | Year-6 | Year-7 | Year-8 | Year-9 |
|---|---|---|---|---|---|---|---|---|---|---|
| 1990's | 2,939 | 3,101 | 2,943 | 3,679 | 4,023 | 3,904 | 2,940 | |||
| 2000's | 3,475 | 3,675 | 3,388 | 3,519 | 3,953 | 3,859 | 3,477 | 3,066 | 2,977 | 2,701 |
| 2010's | 2,392 | 2,604 | 2,404 | 2,689 | 3,247 | 3,578 | 3,875 | 2,738 | 2,399 | 2,279 |
| 2020's | 1,863 | 2,045 | 1,909 | 1,989 |
| - = No Data Reported; -- = Not Applicable; NA = Not Available; W = Withheld to avoid disclosure of individual company data. |
| Release Date: 8/30/2024 |
| Next Release Date: 8/29/2025 |