|
Download Data (XLS File) |
|
||||||||
|
||||||||
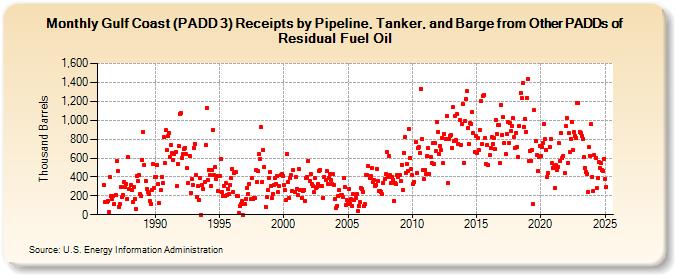
| Gulf Coast (PADD 3) Receipts by Pipeline, Tanker, and Barge from Other PADDs of Residual Fuel Oil (Thousand Barrels) | ||||||||
| Year | Jan | Feb | Mar | Apr | May | Jun | Jul | Aug | Sep | Oct | Nov | Dec |
|---|---|---|---|---|---|---|---|---|---|---|---|---|
| 1986 | 316 | 130 | 130 | 138 | 150 | 33 | 394 | 193 | 165 | 195 | 113 | 206 |
| 1987 | 564 | 461 | 85 | 114 | 292 | 187 | 207 | 346 | 296 | 327 | 170 | 607 |
| 1988 | 271 | 316 | 263 | 130 | 289 | 171 | 57 | 413 | 356 | 424 | 222 | 200 |
| 1989 | 581 | 877 | 531 | 357 | 272 | 240 | 214 | 146 | 118 | 263 | 532 | 286 |
| 1990 | 399 | 399 | 526 | 323 | 120 | 258 | 400 | 340 | 818 | 548 | 893 | 682 |
| 1991 | 835 | 868 | 611 | 739 | 649 | 580 | 642 | 662 | 302 | 539 | 729 | 1,066 |
| 1992 | 1,074 | 603 | 640 | 699 | 710 | 641 | 489 | 336 | 624 | 234 | 377 | 319 |
| 1993 | 705 | 749 | 417 | 191 | 299 | 153 | 387 | 0 | 311 | 270 | 345 | 738 |
| 1994 | 1,134 | 371 | 475 | 425 | 305 | 475 | 899 | 416 | 500 | 382 | 412 | 247 |
| 1995 | 407 | 587 | 237 | 195 | 308 | 196 | 331 | 204 | 277 | 218 | 316 | 388 |
| 1996 | 487 | 238 | 437 | 447 | 202 | 203 | 16 | 88 | 113 | 141 | 0 | 109 |
| 1997 | 109 | 171 | 286 | 223 | 328 | 165 | 385 | 163 | 182 | 181 | 472 | 347 |
| 1998 | 462 | 638 | 590 | 925 | 351 | 686 | 500 | 85 | 187 | 257 | 388 | 448 |
| 1999 | 301 | 175 | 223 | 316 | 386 | 329 | 412 | 236 | 302 | 415 | 429 | 412 |
| 2000 | 312 | 260 | 151 | 646 | 344 | 179 | 384 | 415 | 248 | 471 | 245 | 402 |
| 2001 | 277 | 204 | 481 | 266 | 260 | 179 | 248 | 265 | 145 | 391 | 401 | 573 |
| 2002 | 358 | 430 | 324 | 305 | 236 | 392 | 282 | 295 | 329 | 467 | 478 | 300 |
| 2003 | 306 | 178 | 397 | 371 | 460 | 327 | 393 | 426 | 367 | 326 | 428 | 312 |
| 2004 | 162 | 71 | 95 | 193 | 257 | 205 | 211 | 185 | 384 | 289 | 104 | 154 |
| 2005 | 110 | 274 | 120 | 165 | 96 | 216 | 156 | 181 | 221 | 41 | 96 | 136 |
| 2006 | 282 | 271 | 241 | 93 | 110 | 423 | 418 | 516 | 385 | 411 | 490 | 344 |
| 2007 | 370 | 306 | 312 | 488 | 359 | 253 | 255 | 243 | 217 | 339 | 374 | 428 |
| 2008 | 668 | 397 | 622 | 417 | 335 | 402 | 372 | 148 | 338 | 321 | 424 | 404 |
| 2009 | 416 | 354 | 530 | 258 | 657 | 821 | 444 | 540 | 460 | 908 | 601 | 485 |
| 2010 | 417 | 327 | 351 | 769 | 440 | 701 | 712 | 650 | 1,332 | 803 | 474 | 374 |
| 2011 | 476 | 428 | 623 | 702 | 436 | 612 | 547 | 754 | 540 | 757 | 673 | 982 |
| 2012 | 879 | 644 | 727 | 680 | 813 | 544 | 857 | 806 | 1,042 | 332 | 796 | 833 |
| 2013 | 848 | 705 | 1,138 | 779 | 1,047 | 786 | 1,065 | 746 | 1,005 | 735 | 961 | 1,169 |
| 2014 | 552 | 990 | 1,228 | 1,308 | 920 | 747 | 972 | 964 | 1,085 | 860 | 664 | 834 |
| 2015 | 656 | 809 | 686 | 901 | 1,200 | 744 | 1,261 | 1,268 | 813 | 534 | 736 | 531 |
| 2016 | 631 | 706 | 818 | 753 | 808 | 695 | 1,000 | 859 | 947 | 946 | 552 | 1,164 |
| 2017 | 844 | 1,029 | 762 | 641 | 854 | 981 | 759 | 967 | 881 | 934 | 1,019 | 822 |
| 2018 | 711 | 869 | 715 | 613 | 940 | 1,288 | 1,234 | 1,392 | 928 | 1,013 | 878 | 1,238 |
| 2019 | 1,433 | 571 | 679 | 571 | 686 | 110 | 1,103 | 779 | 637 | 458 | 606 | 728 |
| 2020 | 624 | 713 | 759 | 957 | 797 | 685 | 403 | 437 | 720 | 799 | 548 | 497 |
| 2021 | 502 | 287 | 521 | 473 | 509 | 756 | 571 | 860 | 597 | 624 | 437 | 936 |
| 2022 | 1,028 | 550 | 860 | 664 | 805 | 984 | 687 | 874 | 835 | 813 | 1,179 | 1,185 |
| 2023 | 880 | 865 | 832 | 797 | 560 | 495 | 456 | 433 | 239 | 714 | 621 | 955 |
| 2024 | 400 | |||||||||||
| - = No Data Reported; -- = Not Applicable; NA = Not Available; W = Withheld to avoid disclosure of individual company data. |
| Release Date: 3/29/2024 |
| Next Release Date: 4/30/2024 |