|
Download Data (XLS File) |
|
||||||||
|
||||||||
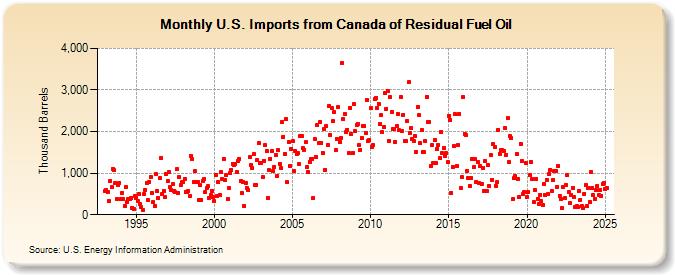
| U.S. Imports from Canada of Residual Fuel Oil (Thousand Barrels) | ||||||||
| Year | Jan | Feb | Mar | Apr | May | Jun | Jul | Aug | Sep | Oct | Nov | Dec |
|---|---|---|---|---|---|---|---|---|---|---|---|---|
| 1993 | 576 | 589 | 547 | 322 | 808 | 659 | 1,110 | 1,068 | 768 | 374 | 711 | 764 |
| 1994 | 373 | 524 | 374 | 221 | 677 | 304 | 382 | 382 | 412 | 165 | 137 | 447 |
| 1995 | 411 | 331 | 506 | 250 | 174 | 114 | 498 | 595 | 762 | 348 | 797 | 909 |
| 1996 | 526 | 294 | 207 | 972 | 573 | 402 | 874 | 1,367 | 504 | 572 | 422 | 986 |
| 1997 | 800 | 1,022 | 672 | 592 | 733 | 582 | 536 | 1,089 | 528 | 906 | 720 | 777 |
| 1998 | 791 | 859 | 552 | 558 | 573 | 449 | 1,416 | 1,339 | 798 | 1,044 | 787 | 777 |
| 1999 | 361 | 707 | 358 | 820 | 869 | 540 | 635 | 684 | 402 | 477 | 578 | 418 |
| 2000 | 321 | 954 | 440 | 785 | 481 | 1,025 | 862 | 1,345 | 834 | 947 | 372 | 634 |
| 2001 | 1,010 | 1,079 | 1,231 | 1,184 | 1,214 | 1,020 | 1,299 | 1,349 | 807 | 526 | 784 | 220 |
| 2002 | 770 | 638 | 592 | 1,380 | 1,191 | 1,127 | 1,454 | 709 | 724 | 1,312 | 1,715 | 1,234 |
| 2003 | 1,253 | 903 | 1,298 | 1,671 | 1,528 | 409 | 1,068 | 1,350 | 1,531 | 1,050 | 1,151 | 1,436 |
| 2004 | 929 | 1,548 | 1,230 | 1,117 | 2,231 | 1,877 | 1,470 | 2,298 | 776 | 1,744 | 1,175 | 1,589 |
| 2005 | 1,761 | 1,050 | 1,541 | 1,464 | 1,475 | 1,227 | 1,894 | 1,898 | 1,596 | 1,568 | 1,738 | 1,159 |
| 2006 | 1,028 | 1,270 | 1,345 | 1,349 | 400 | 1,821 | 1,391 | 2,146 | 1,723 | 2,226 | 1,733 | 1,490 |
| 2007 | 2,069 | 1,085 | 2,126 | 1,686 | 2,619 | 1,925 | 2,556 | 2,246 | 2,468 | 1,551 | 1,827 | 2,588 |
| 2008 | 1,746 | 1,848 | 3,649 | 2,303 | 2,431 | 1,979 | 2,048 | 1,473 | 2,573 | 1,949 | 1,480 | 2,658 |
| 2009 | 2,004 | 2,158 | 2,191 | 1,676 | 1,567 | 1,849 | 2,136 | 2,132 | 1,976 | 2,765 | 1,776 | 1,791 |
| 2010 | 2,555 | 1,635 | 1,674 | 2,781 | 2,818 | 2,572 | 2,673 | 2,180 | 2,397 | 1,978 | 2,119 | 2,927 |
| 2011 | 2,553 | 2,986 | 1,778 | 2,826 | 2,470 | 2,062 | 2,067 | 1,746 | 2,122 | 2,422 | 2,026 | 2,826 |
| 2012 | 2,004 | 2,407 | 1,772 | 1,763 | 2,260 | 3,180 | 1,969 | 2,089 | 1,813 | 1,768 | 1,883 | 1,516 |
| 2013 | 2,596 | 2,395 | 1,713 | 2,032 | 1,518 | 1,502 | 1,767 | 2,834 | 2,223 | 2,224 | 1,168 | 1,674 |
| 2014 | 1,249 | 1,795 | 1,251 | 1,589 | 1,676 | 1,356 | 1,993 | 1,474 | 1,610 | 1,411 | 1,474 | 1,263 |
| 2015 | 2,381 | 2,273 | 526 | 1,154 | 1,647 | 2,415 | 1,183 | 1,673 | 2,422 | 640 | 901 | 2,830 |
| 2016 | 1,947 | 1,917 | 1,062 | 885 | 701 | 880 | 1,350 | 1,147 | 1,333 | 795 | 1,266 | 762 |
| 2017 | 1,169 | 731 | 1,123 | 580 | 1,283 | 582 | 1,194 | 693 | 1,442 | 845 | 1,690 | 1,635 |
| 2018 | 693 | 785 | 2,041 | 1,470 | 1,547 | 1,550 | 1,532 | 2,086 | 1,444 | 2,319 | 1,256 | 1,884 |
| 2019 | 1,836 | 371 | 875 | 925 | 1,467 | 868 | 429 | 1,701 | 1,289 | 491 | 540 | 1,239 |
| 2020 | 435 | 541 | 945 | 1,276 | 870 | 302 | 596 | 856 | 387 | 260 | 484 | 322 |
| 2021 | 225 | 744 | 473 | 842 | 501 | 981 | 1,082 | 580 | 839 | 1,047 | 1,057 | 677 |
| 2022 | 1,176 | 457 | 377 | 167 | 673 | 395 | 719 | 957 | 537 | 286 | 486 | 649 |
| 2023 | 431 | 192 | 209 | 196 | 574 | 365 | 207 | 134 | 514 | 659 | 206 | 631 |
| 2024 | 311 | |||||||||||
| - = No Data Reported; -- = Not Applicable; NA = Not Available; W = Withheld to avoid disclosure of individual company data. |
| Release Date: 3/29/2024 |
| Next Release Date: 4/30/2024 |