|
Download Data (XLS File) |
|
||||||||
|
||||||||
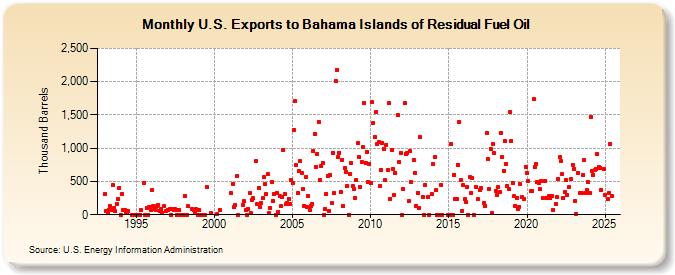
| U.S. Exports to Bahama Islands of Residual Fuel Oil (Thousand Barrels) | ||||||||
| Year | Jan | Feb | Mar | Apr | May | Jun | Jul | Aug | Sep | Oct | Nov | Dec |
|---|---|---|---|---|---|---|---|---|---|---|---|---|
| 1993 | 311 | 56 | 32 | 65 | 132 | 78 | 440 | 105 | 49 | 164 | 233 | 402 |
| 1994 | 0 | 316 | 68 | 70 | 31 | 44 | 52 | 0 | 0 | 0 | ||
| 1995 | 0 | 0 | 0 | 66 | 478 | 0 | 105 | 0 | 123 | 78 | ||
| 1996 | 371 | 128 | 88 | 65 | 131 | 152 | 59 | 91 | 33 | 127 | 60 | |
| 1997 | 77 | 79 | 0 | 81 | 65 | 85 | 0 | 74 | 70 | 0 | 0 | |
| 1998 | 0 | 279 | 0 | 0 | 127 | 84 | 64 | 34 | 80 | 0 | ||
| 1999 | 75 | 1 | 0 | 0 | 0 | 420 | 24 | |||||
| 2000 | 4 | 69 | ||||||||||
| 2001 | 319 | 469 | 110 | 144 | 577 | 0 | 145 | 200 | ||||
| 2002 | 69 | 0 | 93 | 330 | 20 | 228 | 250 | 808 | 156 | 405 | 118 | |
| 2003 | 176 | 251 | 564 | 455 | 308 | 610 | 22 | 106 | 492 | 212 | 316 | 0 |
| 2004 | 326 | 48 | 274 | 127 | 260 | 974 | 313 | 156 | 179 | 242 | 162 | 529 |
| 2005 | 472 | 1,274 | 1,707 | 740 | 324 | 654 | 802 | 634 | 382 | 135 | 569 | 116 |
| 2006 | 287 | 64 | 132 | 166 | 954 | 1,218 | 722 | 918 | 1,396 | 524 | 736 | 784 |
| 2007 | 1 | 81 | 318 | 579 | 60 | 597 | 170 | 933 | 323 | 2,014 | 2,179 | 871 |
| 2008 | 933 | 338 | 826 | 138 | 703 | 645 | 427 | 0 | 614 | 776 | 426 | 386 |
| 2009 | 251 | 520 | 1,073 | 869 | 413 | 797 | 1,020 | 1,686 | 782 | 950 | 495 | 768 |
| 2010 | 470 | 1,692 | 1,382 | 1,165 | 1,547 | 1,060 | 1,096 | 430 | 679 | 1,080 | 994 | 515 |
| 2011 | 1,054 | 673 | 1,673 | 240 | 966 | 691 | 303 | 632 | 1,497 | 792 | 935 | |
| 2012 | 1 | 393 | 1,672 | 919 | 932 | 200 | 951 | 493 | 824 | 627 | 135 | |
| 2013 | 332 | 108 | 1,166 | 268 | 0 | 445 | 267 | 0 | 306 | |||
| 2014 | 757 | 868 | 366 | 0 | 0 | 440 | 0 | 0 | ||||
| 2015 | 0 | 0 | 1,062 | 0 | 602 | 229 | 235 | 754 | 1,394 | 525 | 60 | 440 |
| 2016 | 232 | 190 | 422 | 0 | 561 | 327 | 555 | 1 | 418 | 230 | ||
| 2017 | 377 | 397 | 177 | 138 | 1,229 | 832 | 386 | 993 | 19 | 1,069 | 928 | |
| 2018 | 363 | 298 | 410 | 340 | 1,235 | 867 | 662 | 1,110 | 767 | 429 | 387 | 1,547 |
| 2019 | 1,110 | 475 | 281 | 129 | 254 | 90 | 122 | 455 | 260 | 239 | 721 | |
| 2020 | 629 | 510 | 359 | 355 | 1,736 | 722 | 764 | 495 | 482 | 390 | 511 | |
| 2021 | 258 | 503 | 256 | 275 | 252 | 274 | 78 | 163 | 265 | |||
| 2022 | 535 | 863 | 800 | 608 | 252 | 339 | 521 | 300 | 414 | 533 | 753 | |
| 2023 | 695 | 206 | 18 | 634 | 330 | 325 | 400 | 821 | 331 | 366 | 494 | |
| 2024 | 661 | 2,527 | 660 | 631 | ||||||||
| - = No Data Reported; -- = Not Applicable; NA = Not Available; W = Withheld to avoid disclosure of individual company data. |
| Release Date: 6/28/2024 |
| Next Release Date: 7/31/2024 |