|
Download Data (XLS File) |
|
||||||||
|
||||||||
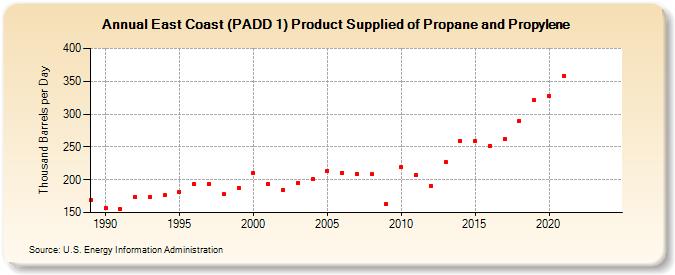
| East Coast (PADD 1) Product Supplied of Propane and Propylene (Thousand Barrels per Day) | ||||||||
| Decade | Year-0 | Year-1 | Year-2 | Year-3 | Year-4 | Year-5 | Year-6 | Year-7 | Year-8 | Year-9 |
|---|---|---|---|---|---|---|---|---|---|---|
| 1980's | 169 | |||||||||
| 1990's | 157 | 155 | 174 | 174 | 176 | 182 | 193 | 194 | 178 | 188 |
| 2000's | 210 | 194 | 184 | 195 | 201 | 214 | 211 | 209 | 208 | 163 |
| 2010's | 219 | 207 | 191 | 227 | 259 | 259 | 252 | 262 | 290 | 321 |
| 2020's | 328 | 358 | -- | -- |
| - = No Data Reported; -- = Not Applicable; NA = Not Available; W = Withheld to avoid disclosure of individual company data. |
| Release Date: 3/29/2024 |
| Next Release Date: 8/30/2024 |