|
Download Data (XLS File) |
|
||||||||
|
||||||||
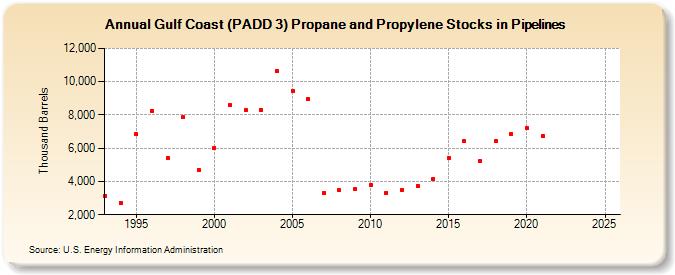
| Gulf Coast (PADD 3) Propane and Propylene Stocks in Pipelines (Thousand Barrels) | ||||||||
| Decade | Year-0 | Year-1 | Year-2 | Year-3 | Year-4 | Year-5 | Year-6 | Year-7 | Year-8 | Year-9 |
|---|---|---|---|---|---|---|---|---|---|---|
| 1990's | 3,133 | 2,727 | 6,830 | 8,264 | 5,417 | 7,849 | 4,694 | |||
| 2000's | 6,041 | 8,588 | 8,274 | 8,288 | 10,637 | 9,467 | 8,963 | 3,329 | 3,456 | 3,544 |
| 2010's | 3,811 | 3,328 | 3,513 | 3,749 | 4,170 | 5,418 | 6,406 | 5,244 | 6,425 | 6,880 |
| 2020's | 7,199 | 6,740 | -- | -- |
| - = No Data Reported; -- = Not Applicable; NA = Not Available; W = Withheld to avoid disclosure of individual company data. |
| Release Date: 6/28/2024 |
| Next Release Date: 8/30/2024 |