|
Download Data (XLS File) |
|
||||||||
|
||||||||
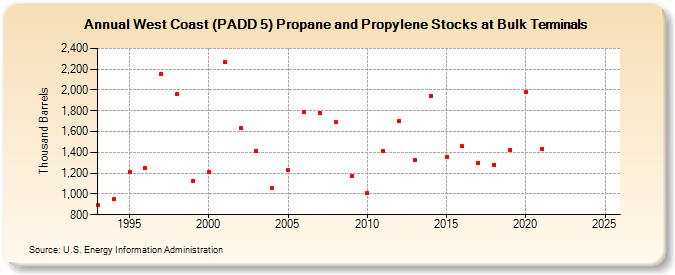
| West Coast (PADD 5) Propane and Propylene Stocks at Bulk Terminals (Thousand Barrels) | ||||||||
| Decade | Year-0 | Year-1 | Year-2 | Year-3 | Year-4 | Year-5 | Year-6 | Year-7 | Year-8 | Year-9 |
|---|---|---|---|---|---|---|---|---|---|---|
| 1990's | 889 | 949 | 1,212 | 1,246 | 2,154 | 1,963 | 1,126 | |||
| 2000's | 1,214 | 2,272 | 1,634 | 1,411 | 1,061 | 1,231 | 1,786 | 1,778 | 1,693 | 1,173 |
| 2010's | 1,008 | 1,414 | 1,701 | 1,327 | 1,943 | 1,354 | 1,457 | 1,300 | 1,282 | 1,427 |
| 2020's | 1,982 | 1,431 | -- | -- |
| - = No Data Reported; -- = Not Applicable; NA = Not Available; W = Withheld to avoid disclosure of individual company data. |
| Release Date: 8/30/2024 |
| Next Release Date: 8/29/2025 |