|
Download Data (XLS File) |
|
||||||||
|
||||||||
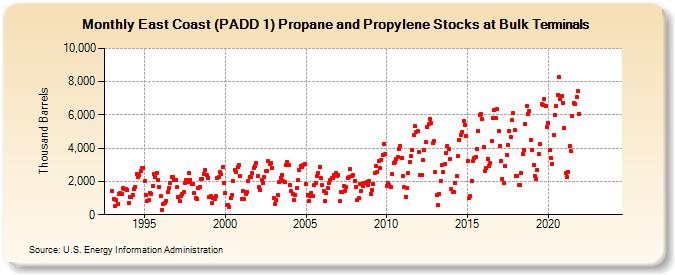
| East Coast (PADD 1) Propane and Propylene Stocks at Bulk Terminals (Thousand Barrels) | ||||||||
| Year | Jan | Feb | Mar | Apr | May | Jun | Jul | Aug | Sep | Oct | Nov | Dec |
|---|---|---|---|---|---|---|---|---|---|---|---|---|
| 1993 | 1,420 | 953 | 519 | 868 | 653 | 1,272 | 1,329 | 1,238 | 1,604 | 1,516 | 1,549 | 1,503 |
| 1994 | 708 | 1,084 | 1,039 | 1,204 | 1,516 | 1,689 | 2,469 | 2,293 | 2,368 | 2,630 | 2,818 | 2,825 |
| 1995 | 2,011 | 1,202 | 826 | 863 | 1,333 | 1,251 | 1,727 | 2,443 | 2,246 | 2,535 | 2,084 | 1,683 |
| 1996 | 1,120 | 294 | 674 | 724 | 845 | 1,354 | 1,605 | 1,900 | 2,268 | 2,275 | 2,109 | 2,100 |
| 1997 | 1,646 | 1,042 | 838 | 1,119 | 1,264 | 1,337 | 1,915 | 2,080 | 1,991 | 2,509 | 2,114 | 1,866 |
| 1998 | 1,860 | 1,294 | 997 | 949 | 1,595 | 1,675 | 2,140 | 2,174 | 2,449 | 2,709 | 2,358 | 2,222 |
| 1999 | 1,082 | 1,107 | 713 | 1,023 | 940 | 1,103 | 2,192 | 2,290 | 2,572 | 2,427 | 2,855 | 1,923 |
| 2000 | 1,279 | 556 | 592 | 483 | 992 | 1,162 | 2,007 | 2,699 | 2,589 | 2,858 | 2,978 | 2,339 |
| 2001 | 937 | 1,410 | 925 | 1,233 | 1,394 | 2,005 | 2,291 | 2,238 | 2,516 | 2,808 | 2,932 | 3,103 |
| 2002 | 2,303 | 1,659 | 1,501 | 2,116 | 1,901 | 2,267 | 2,631 | 2,651 | 3,213 | 3,024 | 3,132 | 2,791 |
| 2003 | 995 | 674 | 883 | 1,180 | 1,978 | 2,228 | 2,392 | 2,021 | 1,960 | 2,965 | 3,170 | 2,991 |
| 2004 | 1,791 | 1,418 | 1,274 | 880 | 1,214 | 1,606 | 2,069 | 2,712 | 2,951 | 2,888 | 2,974 | 3,075 |
| 2005 | 1,841 | 1,214 | 797 | 1,123 | 1,302 | 1,147 | 1,765 | 1,917 | 2,315 | 2,484 | 2,860 | 2,193 |
| 2006 | 1,762 | 1,439 | 813 | 1,306 | 1,594 | 1,879 | 2,103 | 2,209 | 2,187 | 2,358 | 2,527 | 2,314 |
| 2007 | 2,361 | 796 | 1,371 | 1,375 | 1,739 | 1,451 | 1,665 | 2,213 | 2,238 | 2,735 | 2,357 | 2,404 |
| 2008 | 2,043 | 1,656 | 868 | 990 | 1,857 | 1,429 | 1,710 | 1,923 | 1,903 | 1,954 | 1,764 | 2,011 |
| 2009 | 1,265 | 1,501 | 1,869 | 2,508 | 2,904 | 2,560 | 3,216 | 2,806 | 3,291 | 3,585 | 4,252 | 3,679 |
| 2010 | 1,716 | 1,890 | 1,772 | 1,682 | 2,469 | 3,112 | 3,189 | 3,335 | 3,448 | 3,934 | 4,157 | 3,416 |
| 2011 | 2,299 | 1,649 | 1,084 | 1,614 | 2,496 | 3,169 | 3,516 | 3,865 | 4,767 | 5,311 | 4,991 | 5,006 |
| 2012 | 3,760 | 2,384 | 2,384 | 3,289 | 3,911 | 4,354 | 5,250 | 5,433 | 5,772 | 5,519 | 4,288 | 4,443 |
| 2013 | 2,584 | 1,209 | 561 | 1,274 | 2,015 | 2,978 | 2,569 | 3,031 | 3,701 | 4,110 | 3,944 | 3,343 |
| 2014 | 1,533 | 1,390 | 1,363 | 1,908 | 2,301 | 3,530 | 4,522 | 4,815 | 4,998 | 5,663 | 5,409 | 4,742 |
| 2015 | 3,254 | 981 | 1,133 | 2,056 | 3,235 | 3,438 | 3,498 | 3,956 | 5,037 | 5,992 | 6,065 | 5,725 |
| 2016 | 4,071 | 2,629 | 2,783 | 3,356 | 2,958 | 3,105 | 4,432 | 5,844 | 6,313 | 5,809 | 6,338 | 5,045 |
| 2017 | 4,107 | 3,217 | 2,177 | 1,882 | 2,899 | 3,618 | 4,218 | 5,051 | 4,691 | 5,676 | 6,140 | 5,067 |
| 2018 | 2,345 | 2,327 | 1,772 | 1,788 | 2,504 | 3,670 | 3,906 | 5,426 | 6,549 | 6,084 | 6,212 | 4,507 |
| 2019 | 3,919 | 2,993 | 2,319 | 2,163 | 2,697 | 3,644 | 4,222 | 6,653 | 6,590 | 6,967 | 6,541 | 5,258 |
| 2020 | 5,500 | 3,900 | 3,395 | 3,044 | 4,778 | 6,017 | 6,519 | 7,217 | 8,278 | 6,955 | 7,143 | 6,735 |
| 2021 | 5,196 | 2,518 | 2,277 | 2,586 | 4,119 | 3,813 | 5,965 | 6,689 | 6,668 | 7,056 | 7,431 | 6,063 |
| 2022 | -- | -- | -- | -- | -- | -- | -- | -- | -- | -- | -- | -- |
| 2023 | -- | -- | -- | -- | -- | -- | -- | -- | -- | -- | -- | -- |
| 2024 | -- | |||||||||||
| - = No Data Reported; -- = Not Applicable; NA = Not Available; W = Withheld to avoid disclosure of individual company data. |
| Release Date: 3/29/2024 |
| Next Release Date: 4/30/2024 |