|
Download Data (XLS File) |
|
||||||||
|
||||||||
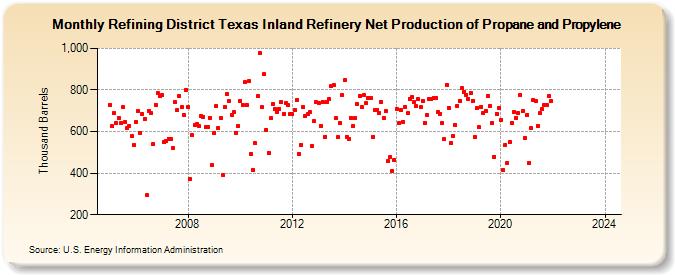
| Refining District Texas Inland Refinery Net Production of Propane and Propylene (Thousand Barrels) | ||||||||
| Year | Jan | Feb | Mar | Apr | May | Jun | Jul | Aug | Sep | Oct | Nov | Dec |
|---|---|---|---|---|---|---|---|---|---|---|---|---|
| 2005 | 730 | 625 | 690 | 640 | 667 | 640 | 718 | 648 | 618 | 629 | 581 | 535 |
| 2006 | 648 | 700 | 595 | 684 | 660 | 293 | 701 | 689 | 540 | 730 | 784 | 772 |
| 2007 | 774 | 548 | 554 | 566 | 565 | 521 | 741 | 703 | 772 | 716 | 681 | 802 |
| 2008 | 719 | 371 | 582 | 630 | 636 | 625 | 674 | 671 | 623 | 622 | 667 | 438 |
| 2009 | 592 | 722 | 617 | 663 | 391 | 718 | 779 | 745 | 680 | 694 | 595 | 629 |
| 2010 | 746 | 729 | 837 | 730 | 842 | 492 | 414 | 543 | 771 | 977 | 717 | 876 |
| 2011 | 607 | 499 | 663 | 734 | 709 | 692 | 709 | 741 | 686 | 736 | 726 | 683 |
| 2012 | 683 | 706 | 751 | 494 | 537 | 718 | 673 | 685 | 694 | 531 | 649 | 740 |
| 2013 | 737 | 629 | 744 | 576 | 742 | 755 | 817 | 822 | 663 | 573 | 642 | 776 |
| 2014 | 846 | 575 | 566 | 667 | 626 | 666 | 732 | 771 | 717 | 777 | 736 | 763 |
| 2015 | 762 | 576 | 703 | 706 | 689 | 742 | 667 | 697 | 457 | 477 | 412 | 463 |
| 2016 | 710 | 640 | 703 | 646 | 719 | 687 | 757 | 764 | 742 | 721 | 755 | 716 |
| 2017 | 748 | 643 | 680 | 757 | 756 | 762 | 763 | 695 | 686 | 642 | 562 | 823 |
| 2018 | 714 | 544 | 580 | 632 | 722 | 749 | 808 | 792 | 778 | 758 | 787 | 749 |
| 2019 | 575 | 715 | 620 | 719 | 690 | 701 | 770 | 723 | 642 | 479 | 685 | 714 |
| 2020 | 657 | 414 | 537 | 450 | 550 | 640 | 696 | 667 | 690 | 776 | 698 | 571 |
| 2021 | 681 | 450 | 615 | 752 | 747 | 629 | 687 | 708 | 728 | 729 | 770 | 746 |
| 2022 | -- | -- | -- | -- | -- | -- | -- | -- | -- | -- | -- | -- |
| 2023 | -- | -- | -- | -- | -- | -- | -- | -- | -- | -- | -- | -- |
| 2024 | -- | |||||||||||
| - = No Data Reported; -- = Not Applicable; NA = Not Available; W = Withheld to avoid disclosure of individual company data. |
| Release Date: 3/29/2024 |
| Next Release Date: 4/30/2024 |