|
Download Data (XLS File) |
|
||||||||
|
||||||||
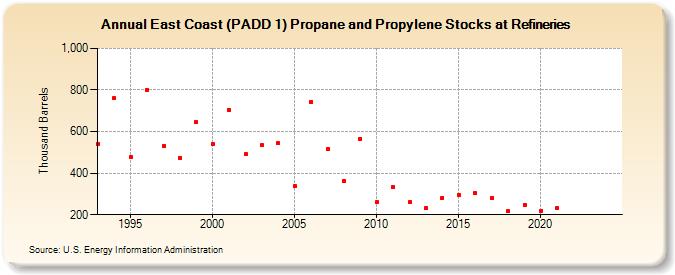
| East Coast (PADD 1) Propane and Propylene Stocks at Refineries (Thousand Barrels) | ||||||||
| Decade | Year-0 | Year-1 | Year-2 | Year-3 | Year-4 | Year-5 | Year-6 | Year-7 | Year-8 | Year-9 |
|---|---|---|---|---|---|---|---|---|---|---|
| 1990's | 542 | 760 | 478 | 801 | 530 | 474 | 644 | |||
| 2000's | 539 | 704 | 490 | 533 | 543 | 338 | 744 | 514 | 360 | 566 |
| 2010's | 259 | 333 | 259 | 233 | 282 | 296 | 303 | 281 | 216 | 248 |
| 2020's | 220 | 232 | -- | -- |
| - = No Data Reported; -- = Not Applicable; NA = Not Available; W = Withheld to avoid disclosure of individual company data. |
| Release Date: 6/28/2024 |
| Next Release Date: 8/30/2024 |