|
Download Data (XLS File) |
|
||||||||
|
||||||||
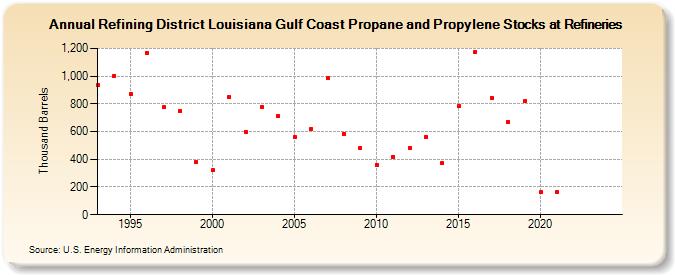
| Refining District Louisiana Gulf Coast Propane and Propylene Stocks at Refineries (Thousand Barrels) | ||||||||
| Decade | Year-0 | Year-1 | Year-2 | Year-3 | Year-4 | Year-5 | Year-6 | Year-7 | Year-8 | Year-9 |
|---|---|---|---|---|---|---|---|---|---|---|
| 1990's | 933 | 1,004 | 872 | 1,170 | 775 | 748 | 379 | |||
| 2000's | 320 | 851 | 599 | 778 | 711 | 558 | 620 | 983 | 585 | 481 |
| 2010's | 362 | 420 | 483 | 563 | 372 | 783 | 1,177 | 844 | 669 | 818 |
| 2020's | 162 | 164 | -- | -- |
| - = No Data Reported; -- = Not Applicable; NA = Not Available; W = Withheld to avoid disclosure of individual company data. |
| Release Date: 8/30/2024 |
| Next Release Date: 8/29/2025 |
Referring Pages: