|
Download Data (XLS File) |
|
||||||||
|
||||||||
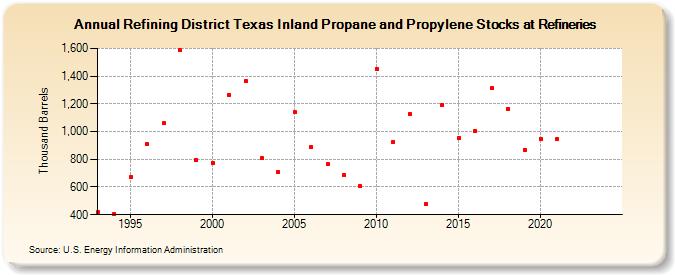
| Refining District Texas Inland Propane and Propylene Stocks at Refineries (Thousand Barrels) | ||||||||
| Decade | Year-0 | Year-1 | Year-2 | Year-3 | Year-4 | Year-5 | Year-6 | Year-7 | Year-8 | Year-9 |
|---|---|---|---|---|---|---|---|---|---|---|
| 1990's | 416 | 406 | 671 | 908 | 1,059 | 1,585 | 795 | |||
| 2000's | 773 | 1,266 | 1,364 | 807 | 708 | 1,139 | 885 | 764 | 685 | 607 |
| 2010's | 1,452 | 926 | 1,128 | 477 | 1,190 | 956 | 1,005 | 1,314 | 1,165 | 870 |
| 2020's | 949 | 948 | -- | -- |
| - = No Data Reported; -- = Not Applicable; NA = Not Available; W = Withheld to avoid disclosure of individual company data. |
| Release Date: 3/29/2024 |
| Next Release Date: 8/30/2024 |
Referring Pages: