|
Download Data (XLS File) |
|
||||||||
|
||||||||
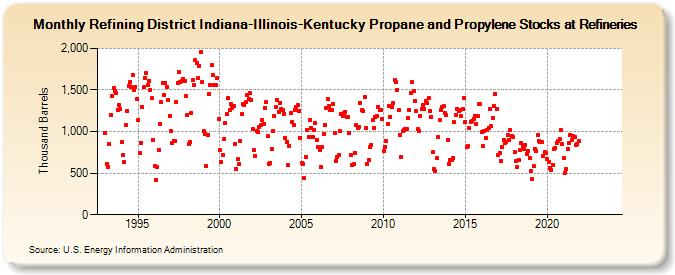
| Refining District Indiana-Illinois-Kentucky Propane and Propylene Stocks at Refineries (Thousand Barrels) | ||||||||
| Year | Jan | Feb | Mar | Apr | May | Jun | Jul | Aug | Sep | Oct | Nov | Dec |
|---|---|---|---|---|---|---|---|---|---|---|---|---|
| 1993 | 983 | 611 | 572 | 850 | 1,199 | 1,424 | 1,522 | 1,484 | 1,463 | 1,259 | 1,317 | 1,269 |
| 1994 | 877 | 713 | 635 | 1,073 | 1,253 | 1,553 | 1,590 | 1,536 | 1,685 | 1,502 | 1,533 | 1,390 |
| 1995 | 1,133 | 741 | 868 | 1,299 | 1,532 | 1,649 | 1,699 | 1,561 | 1,611 | 1,500 | 1,399 | 897 |
| 1996 | 589 | 421 | 579 | 782 | 1,095 | 1,350 | 1,587 | 1,440 | 1,578 | 1,538 | 1,380 | 1,191 |
| 1997 | 1,004 | 861 | 890 | 886 | 1,359 | 1,583 | 1,711 | 1,599 | 1,607 | 1,635 | 1,612 | 1,422 |
| 1998 | 1,196 | 845 | 880 | 1,227 | 1,619 | 1,565 | 1,855 | 1,823 | 1,645 | 1,791 | 1,956 | 1,592 |
| 1999 | 1,002 | 968 | 584 | 959 | 1,450 | 1,554 | 1,797 | 1,680 | 1,556 | 1,557 | 1,638 | 1,150 |
| 2000 | 776 | 634 | 715 | 915 | 1,098 | 1,206 | 1,402 | 1,256 | 1,332 | 1,287 | 1,303 | 855 |
| 2001 | 548 | 666 | 606 | 892 | 1,206 | 1,330 | 1,317 | 1,352 | 1,436 | 1,395 | 1,463 | 1,381 |
| 2002 | 1,025 | 776 | 706 | 1,005 | 994 | 1,060 | 1,075 | 1,144 | 1,088 | 1,286 | 1,352 | 943 |
| 2003 | 615 | 626 | 791 | 1,004 | 1,187 | 1,296 | 1,383 | 1,241 | 1,349 | 1,273 | 1,258 | 1,216 |
| 2004 | 928 | 879 | 599 | 830 | 1,224 | 1,116 | 1,078 | 1,264 | 1,294 | 1,318 | 1,244 | 926 |
| 2005 | 627 | 611 | 438 | 693 | 1,015 | 932 | 1,144 | 1,044 | 940 | 1,013 | 1,099 | 903 |
| 2006 | 809 | 778 | 578 | 809 | 969 | 1,082 | 1,279 | 1,394 | 1,302 | 1,264 | 1,263 | 1,328 |
| 2007 | 984 | 650 | 692 | 718 | 1,007 | 1,209 | 1,189 | 1,224 | 1,241 | 1,181 | 1,173 | 984 |
| 2008 | 715 | 594 | 608 | 743 | 1,078 | 1,039 | 1,060 | 1,342 | 1,257 | 1,243 | 1,411 | 1,040 |
| 2009 | 604 | 658 | 811 | 843 | 1,135 | 1,046 | 1,172 | 1,191 | 1,296 | 1,254 | 1,261 | 1,149 |
| 2010 | 771 | 815 | 884 | 1,087 | 1,303 | 1,178 | 1,294 | 1,341 | 1,617 | 1,595 | 1,505 | 1,259 |
| 2011 | 964 | 692 | 1,001 | 1,018 | 1,035 | 1,032 | 1,161 | 1,256 | 1,469 | 1,592 | 1,482 | 1,365 |
| 2012 | 1,246 | 1,027 | 1,002 | 1,193 | 1,268 | 1,324 | 1,269 | 1,364 | 1,345 | 1,406 | 1,242 | 1,178 |
| 2013 | 752 | 548 | 522 | 678 | 930 | 1,133 | 1,256 | 1,292 | 1,307 | 1,223 | 1,200 | 898 |
| 2014 | 615 | 657 | 656 | 681 | 1,113 | 1,205 | 1,266 | 1,252 | 1,264 | 1,187 | 1,267 | 1,408 |
| 2015 | 1,119 | 809 | 822 | 1,045 | 1,119 | 1,132 | 1,154 | 1,186 | 1,096 | 1,188 | 1,334 | 1,328 |
| 2016 | 997 | 827 | 1,001 | 925 | 1,017 | 1,047 | 1,269 | 1,062 | 1,168 | 1,313 | 1,457 | 1,272 |
| 2017 | 720 | 748 | 647 | 812 | 900 | 857 | 871 | 958 | 896 | 1,018 | 949 | 929 |
| 2018 | 752 | 642 | 578 | 661 | 774 | 860 | 830 | 788 | 837 | 736 | 763 | 687 |
| 2019 | 529 | 425 | 582 | 794 | 763 | 957 | 885 | 879 | 872 | 708 | 750 | 738 |
| 2020 | 666 | 631 | 565 | 540 | 592 | 785 | 808 | 860 | 889 | 913 | 1,014 | 850 |
| 2021 | 682 | 502 | 544 | 795 | 866 | 955 | 895 | 949 | 940 | 842 | 852 | 884 |
| 2022 | -- | -- | -- | -- | -- | -- | -- | -- | -- | -- | -- | -- |
| 2023 | -- | -- | -- | -- | -- | -- | -- | -- | -- | -- | -- | -- |
| 2024 | -- | |||||||||||
| - = No Data Reported; -- = Not Applicable; NA = Not Available; W = Withheld to avoid disclosure of individual company data. |
| Release Date: 3/29/2024 |
| Next Release Date: 4/30/2024 |