|
Download Data (XLS File) |
|
||||||||
|
||||||||
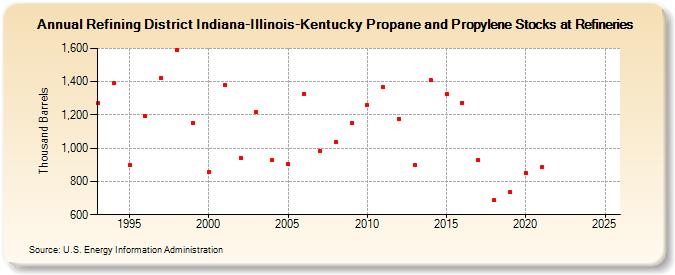
| Refining District Indiana-Illinois-Kentucky Propane and Propylene Stocks at Refineries (Thousand Barrels) | ||||||||
| Decade | Year-0 | Year-1 | Year-2 | Year-3 | Year-4 | Year-5 | Year-6 | Year-7 | Year-8 | Year-9 |
|---|---|---|---|---|---|---|---|---|---|---|
| 1990's | 1,269 | 1,390 | 897 | 1,191 | 1,422 | 1,592 | 1,150 | |||
| 2000's | 855 | 1,381 | 943 | 1,216 | 926 | 903 | 1,328 | 984 | 1,040 | 1,149 |
| 2010's | 1,259 | 1,365 | 1,178 | 898 | 1,408 | 1,328 | 1,272 | 929 | 687 | 738 |
| 2020's | 850 | 884 | -- | -- |
| - = No Data Reported; -- = Not Applicable; NA = Not Available; W = Withheld to avoid disclosure of individual company data. |
| Release Date: 8/30/2024 |
| Next Release Date: 8/29/2025 |