|
Download Data (XLS File) |
|
||||||||
|
||||||||
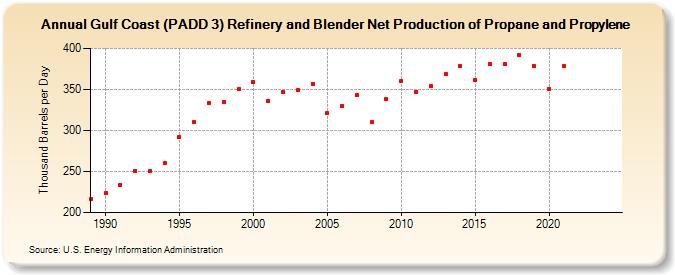
| Gulf Coast (PADD 3) Refinery and Blender Net Production of Propane and Propylene (Thousand Barrels per Day) | ||||||||
| Decade | Year-0 | Year-1 | Year-2 | Year-3 | Year-4 | Year-5 | Year-6 | Year-7 | Year-8 | Year-9 |
|---|---|---|---|---|---|---|---|---|---|---|
| 1980's | 216 | |||||||||
| 1990's | 224 | 234 | 251 | 251 | 260 | 292 | 310 | 334 | 335 | 350 |
| 2000's | 359 | 336 | 347 | 349 | 357 | 321 | 330 | 343 | 310 | 338 |
| 2010's | 360 | 347 | 354 | 369 | 378 | 361 | 381 | 381 | 392 | 378 |
| 2020's | 350 | 378 | -- | -- |
| - = No Data Reported; -- = Not Applicable; NA = Not Available; W = Withheld to avoid disclosure of individual company data. |
| Release Date: 6/28/2024 |
| Next Release Date: 8/30/2024 |