|
Download Data (XLS File) |
|
||||||||
|
||||||||
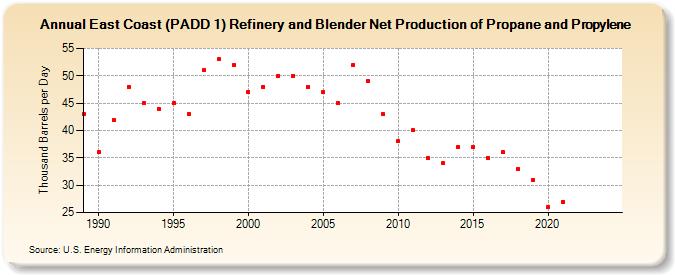
| East Coast (PADD 1) Refinery and Blender Net Production of Propane and Propylene (Thousand Barrels per Day) | ||||||||
| Decade | Year-0 | Year-1 | Year-2 | Year-3 | Year-4 | Year-5 | Year-6 | Year-7 | Year-8 | Year-9 |
|---|---|---|---|---|---|---|---|---|---|---|
| 1980's | 43 | |||||||||
| 1990's | 36 | 42 | 48 | 45 | 44 | 45 | 43 | 51 | 53 | 52 |
| 2000's | 47 | 48 | 50 | 50 | 48 | 47 | 45 | 52 | 49 | 43 |
| 2010's | 38 | 40 | 35 | 34 | 37 | 37 | 35 | 36 | 33 | 31 |
| 2020's | 26 | 27 | -- | -- |
| - = No Data Reported; -- = Not Applicable; NA = Not Available; W = Withheld to avoid disclosure of individual company data. |
| Release Date: 3/29/2024 |
| Next Release Date: 8/30/2024 |