|
Download Data (XLS File) |
|
||||||||
|
||||||||
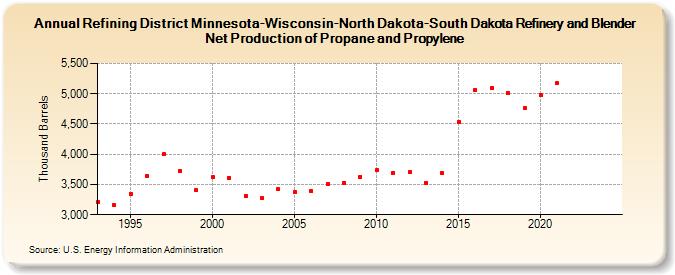
| Refining District Minnesota-Wisconsin-North Dakota-South Dakota Refinery and Blender Net Production of Propane and Propylene (Thousand Barrels) | ||||||||
| Decade | Year-0 | Year-1 | Year-2 | Year-3 | Year-4 | Year-5 | Year-6 | Year-7 | Year-8 | Year-9 |
|---|---|---|---|---|---|---|---|---|---|---|
| 1990's | 3,218 | 3,160 | 3,350 | 3,642 | 3,997 | 3,726 | 3,402 | |||
| 2000's | 3,623 | 3,613 | 3,310 | 3,280 | 3,417 | 3,372 | 3,390 | 3,504 | 3,531 | 3,628 |
| 2010's | 3,735 | 3,691 | 3,703 | 3,531 | 3,689 | 4,529 | 5,060 | 5,096 | 5,017 | 4,758 |
| 2020's | 4,981 | 5,174 | -- | -- |
| - = No Data Reported; -- = Not Applicable; NA = Not Available; W = Withheld to avoid disclosure of individual company data. |
| Release Date: 3/29/2024 |
| Next Release Date: 8/30/2024 |