|
Download Data (XLS File) |
|
||||||||
|
||||||||
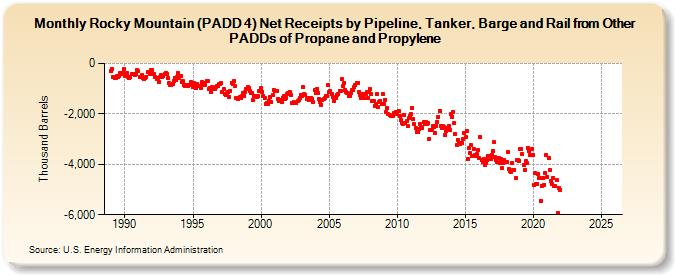
| Rocky Mountain (PADD 4) Net Receipts by Pipeline, Tanker, Barge and Rail from Other PADDs of Propane and Propylene (Thousand Barrels) | ||||||||
| Year | Jan | Feb | Mar | Apr | May | Jun | Jul | Aug | Sep | Oct | Nov | Dec |
|---|---|---|---|---|---|---|---|---|---|---|---|---|
| 1989 | -311 | -211 | -533 | -575 | -595 | -512 | -540 | -486 | -366 | -404 | -366 | -220 |
| 1990 | -477 | -448 | -375 | -528 | -583 | -519 | -411 | -426 | -417 | -453 | -431 | -271 |
| 1991 | -315 | -540 | -524 | -476 | -576 | -629 | -583 | -532 | -327 | -353 | -406 | -266 |
| 1992 | -258 | -402 | -432 | -540 | -598 | -576 | -734 | -552 | -466 | -545 | -500 | -423 |
| 1993 | -363 | -415 | -582 | -786 | -843 | -835 | -812 | -699 | -572 | -668 | -548 | -372 |
| 1994 | -579 | -500 | -732 | -710 | -851 | -890 | -884 | -852 | -895 | -841 | -723 | -758 |
| 1995 | -941 | -773 | -943 | -968 | -808 | -891 | -908 | -955 | -742 | -825 | -786 | -844 |
| 1996 | -700 | -703 | -1,003 | -988 | -1,115 | -944 | -997 | -1,001 | -944 | -904 | -894 | -829 |
| 1997 | -813 | -794 | -1,143 | -1,014 | -1,230 | -1,264 | -1,174 | -1,136 | -1,329 | -1,081 | -761 | -795 |
| 1998 | -705 | -887 | -1,357 | -1,388 | -1,411 | -1,345 | -1,355 | -1,306 | -1,160 | -1,283 | -1,149 | -1,003 |
| 1999 | -944 | -958 | -1,072 | -1,177 | -1,175 | -1,451 | -1,279 | -1,287 | -1,321 | -1,301 | -1,102 | -1,098 |
| 2000 | -960 | -1,140 | -1,273 | -1,374 | -1,591 | -1,565 | -1,622 | -1,505 | -1,322 | -1,522 | -1,255 | -1,041 |
| 2001 | -1,096 | -1,082 | -1,097 | -1,399 | -1,473 | -1,461 | -1,535 | -1,357 | -1,301 | -1,397 | -1,363 | -1,222 |
| 2002 | -1,159 | -1,120 | -1,232 | -1,553 | -1,550 | -1,541 | -1,564 | -1,571 | -1,497 | -1,463 | -1,371 | -1,248 |
| 2003 | -1,279 | -939 | -1,224 | -1,240 | -1,427 | -1,388 | -1,452 | -1,436 | -1,355 | -1,413 | -1,519 | -1,053 |
| 2004 | -1,178 | -998 | -1,171 | -1,419 | -1,511 | -1,629 | -1,440 | -1,422 | -1,369 | -1,280 | -1,286 | -867 |
| 2005 | -1,147 | -1,110 | -1,213 | -1,312 | -1,487 | -1,381 | -1,363 | -1,233 | -1,207 | -1,079 | -1,081 | -635 |
| 2006 | -901 | -776 | -1,050 | -1,112 | -1,176 | -1,304 | -1,281 | -1,188 | -1,070 | -1,060 | -952 | -846 |
| 2007 | -765 | -769 | -1,123 | -1,243 | -1,356 | -1,313 | -1,213 | -1,385 | -1,195 | -1,126 | -1,359 | -1,117 |
| 2008 | -1,006 | -1,214 | -1,490 | -1,481 | -1,673 | -1,615 | -1,206 | -1,742 | -1,546 | -1,484 | -1,622 | -1,209 |
| 2009 | -1,616 | -1,439 | -1,909 | -1,760 | -2,017 | -2,027 | -2,087 | -2,079 | -2,065 | -1,970 | -1,957 | -1,916 |
| 2010 | -2,007 | -1,895 | -2,103 | -2,232 | -2,369 | -2,398 | -2,063 | -2,354 | -2,294 | -2,472 | -2,179 | -2,075 |
| 2011 | -2,007 | -1,757 | -2,198 | -2,402 | -2,551 | -2,713 | -2,728 | -2,598 | -2,406 | -2,520 | -2,544 | -2,338 |
| 2012 | -2,408 | -2,307 | -2,399 | -2,372 | -2,977 | -2,622 | -2,646 | -2,498 | -2,524 | -2,741 | -2,467 | -2,304 |
| 2013 | -2,109 | -1,867 | -2,498 | -2,576 | -2,494 | -2,539 | -2,821 | -2,663 | -2,543 | -2,482 | -2,637 | -2,023 |
| 2014 | -2,111 | -1,926 | -2,368 | -2,798 | -3,234 | -3,018 | -3,158 | -3,183 | -3,137 | -3,162 | -2,987 | -2,742 |
| 2015 | -2,931 | -2,677 | -3,782 | -3,367 | -3,540 | -3,249 | -3,654 | -3,382 | -3,640 | -3,684 | -3,609 | -3,439 |
| 2016 | -3,767 | -2,910 | -3,849 | -3,890 | -3,784 | -4,013 | -3,958 | -3,848 | -3,669 | -3,663 | -3,798 | -3,612 |
| 2017 | -3,482 | -3,133 | -3,716 | -3,831 | -3,926 | -3,739 | -3,933 | -3,785 | -4,153 | -3,963 | -3,848 | -3,897 |
| 2018 | -3,893 | -3,512 | -4,200 | -4,252 | -4,298 | -3,956 | -4,216 | -4,220 | -4,550 | -3,844 | -3,812 | -3,858 |
| 2019 | -3,397 | -3,399 | -3,611 | -4,033 | -4,223 | -3,869 | -3,957 | -3,373 | -3,489 | -3,618 | -3,401 | -3,616 |
| 2020 | -4,821 | -4,363 | -4,787 | -4,775 | -4,368 | -4,524 | -5,441 | -4,848 | -4,539 | -4,809 | -4,349 | -3,647 |
| 2021 | -4,495 | -3,751 | -4,208 | -4,643 | -4,762 | -4,528 | -4,864 | -4,878 | -4,616 | -5,916 | -4,925 | -5,006 |
| 2022 | -- | -- | -- | -- | -- | -- | -- | -- | -- | -- | -- | -- |
| 2023 | -- | -- | -- | -- | -- | -- | -- | -- | -- | -- | -- | -- |
| 2024 | -- | |||||||||||
| - = No Data Reported; -- = Not Applicable; NA = Not Available; W = Withheld to avoid disclosure of individual company data. |
| Release Date: 3/29/2024 |
| Next Release Date: 4/30/2024 |
Referring Pages: