|
Download Data (XLS File) |
|
||||||||
|
||||||||
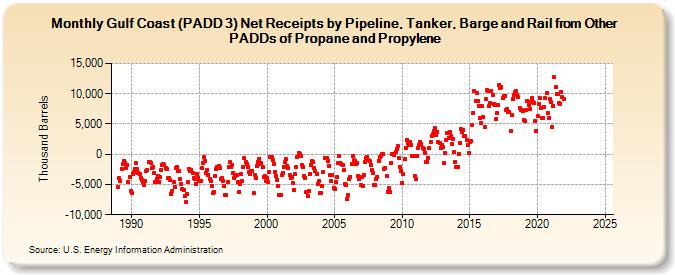
| Gulf Coast (PADD 3) Net Receipts by Pipeline, Tanker, Barge and Rail from Other PADDs of Propane and Propylene (Thousand Barrels) | ||||||||
| Year | Jan | Feb | Mar | Apr | May | Jun | Jul | Aug | Sep | Oct | Nov | Dec |
|---|---|---|---|---|---|---|---|---|---|---|---|---|
| 1989 | -5,479 | -4,006 | -4,397 | -2,361 | -1,672 | -1,040 | -1,467 | -2,311 | -1,721 | -4,639 | -3,763 | -6,022 |
| 1990 | -6,464 | -3,208 | -3,007 | -2,457 | -1,462 | -2,462 | -3,144 | -3,293 | -3,871 | -4,289 | -4,627 | -5,019 |
| 1991 | -4,470 | -2,807 | -2,645 | -1,250 | -1,264 | -1,480 | -2,208 | -2,186 | -3,138 | -4,577 | -4,051 | -3,552 |
| 1992 | -4,602 | -3,845 | -2,637 | -1,765 | -1,554 | -1,748 | -2,225 | -2,510 | -3,941 | -3,936 | -4,303 | -6,503 |
| 1993 | -6,058 | -4,510 | -5,410 | -2,357 | -2,177 | -2,787 | -2,834 | -4,142 | -4,997 | -5,681 | -5,978 | -6,865 |
| 1994 | -7,952 | -6,532 | -4,522 | -2,394 | -2,757 | -2,529 | -3,156 | -3,945 | -4,082 | -4,995 | -3,196 | -3,859 |
| 1995 | -4,378 | -4,438 | -2,289 | -1,379 | -539 | -1,149 | -3,095 | -2,665 | -3,355 | -4,128 | -4,456 | -5,210 |
| 1996 | -6,454 | -6,204 | -3,593 | -2,404 | -2,067 | -1,921 | -2,211 | -4,094 | -3,931 | -4,472 | -5,271 | -6,682 |
| 1997 | -6,786 | -4,632 | -2,158 | -1,348 | -2,077 | -1,764 | -3,030 | -3,917 | -3,660 | -3,432 | -4,667 | -6,184 |
| 1998 | -4,893 | -3,337 | -4,450 | -2,032 | -705 | -1,315 | -1,536 | -2,155 | -2,993 | -3,315 | -2,775 | -2,738 |
| 1999 | -6,442 | -3,488 | -3,941 | -1,902 | -1,310 | -719 | -1,552 | -1,527 | -2,184 | -3,785 | -3,653 | -4,430 |
| 2000 | -3,969 | -4,547 | -2,927 | -508 | -450 | -957 | -1,625 | -2,878 | -3,617 | -4,219 | -5,232 | -6,744 |
| 2001 | -6,818 | -3,451 | -3,120 | -2,059 | -1,338 | -815 | -1,918 | -2,290 | -3,502 | -3,972 | -3,831 | -4,820 |
| 2002 | -5,850 | -3,320 | -2,121 | -430 | 165 | 17 | -356 | -1,781 | -2,045 | -3,545 | -3,864 | -6,166 |
| 2003 | -6,867 | -6,127 | -3,235 | -1,786 | -1,081 | -1,307 | -2,252 | -2,734 | -3,210 | -4,881 | -4,473 | -6,377 |
| 2004 | -6,446 | -5,252 | -2,912 | -618 | -670 | -604 | -1,083 | -1,876 | -3,473 | -4,406 | -3,459 | -5,640 |
| 2005 | -5,789 | -4,652 | -3,694 | -1,437 | -369 | -1,382 | -1,605 | -1,795 | -2,667 | -4,980 | -5,050 | -7,375 |
| 2006 | -6,778 | -4,103 | -3,770 | -1,549 | -223 | -1,028 | -1,106 | -1,626 | -1,387 | -3,545 | -4,116 | -5,102 |
| 2007 | -3,723 | -5,253 | -3,382 | -1,301 | -661 | -436 | -876 | -1,159 | -1,775 | -2,649 | -3,131 | -5,040 |
| 2008 | -5,034 | -4,133 | -3,685 | -1,093 | -512 | -217 | -26 | 115 | -2,419 | -2,203 | -3,548 | -6,210 |
| 2009 | -5,633 | -6,296 | -1,431 | 108 | -24 | -104 | 332 | 808 | 1,318 | -657 | -2,049 | -2,782 |
| 2010 | -4,806 | -3,278 | -815 | 1,103 | 2,378 | 1,884 | 1,533 | 2,045 | 1,487 | -351 | -312 | -3,611 |
| 2011 | -4,162 | -236 | 991 | 1,573 | 2,033 | 1,662 | 1,103 | 857 | 277 | -1,231 | -1,246 | -551 |
| 2012 | 998 | 1,960 | 3,018 | 3,262 | 3,869 | 4,306 | 3,123 | 3,732 | 1,975 | 1,780 | 1,060 | 1,600 |
| 2013 | 1,131 | -1,426 | 238 | 2,333 | 3,522 | 2,737 | 3,677 | 2,941 | 1,730 | 2,573 | 338 | -1,221 |
| 2014 | -2,080 | -2,176 | 17 | 1,920 | 4,164 | 3,754 | 4,080 | 3,081 | 3,089 | 2,273 | 1,504 | 198 |
| 2015 | 2,022 | 2,134 | 4,832 | 6,896 | 10,428 | 8,824 | 10,134 | 8,867 | 8,047 | 5,958 | 5,155 | 7,899 |
| 2016 | 6,149 | 4,481 | 9,151 | 10,627 | 10,450 | 7,994 | 8,396 | 10,482 | 9,797 | 8,318 | 8,147 | 5,905 |
| 2017 | 6,756 | 8,168 | 11,497 | 10,874 | 11,194 | 9,319 | 9,671 | 9,670 | 7,383 | 7,397 | 6,977 | 6,995 |
| 2018 | 3,830 | 6,459 | 9,057 | 9,768 | 10,206 | 10,383 | 9,846 | 9,393 | 7,612 | 7,382 | 7,242 | 7,088 |
| 2019 | 5,581 | 5,517 | 7,377 | 8,846 | 8,187 | 7,414 | 8,555 | 9,358 | 8,578 | 8,438 | 5,448 | 3,881 |
| 2020 | 6,279 | 8,264 | 9,301 | 7,686 | 6,041 | 6,055 | 7,788 | 9,236 | 10,198 | 6,815 | 5,997 | 9,068 |
| 2021 | 8,577 | 4,443 | 8,036 | 12,767 | 11,047 | 9,945 | 10,032 | 8,437 | 8,346 | 10,334 | 9,393 | 9,162 |
| 2022 | -- | -- | -- | -- | -- | -- | -- | -- | -- | -- | -- | -- |
| 2023 | -- | -- | -- | -- | -- | -- | -- | -- | -- | -- | -- | -- |
| 2024 | -- | |||||||||||
| - = No Data Reported; -- = Not Applicable; NA = Not Available; W = Withheld to avoid disclosure of individual company data. |
| Release Date: 3/29/2024 |
| Next Release Date: 4/30/2024 |