|
Download Data (XLS File) |
|
||||||||
|
||||||||
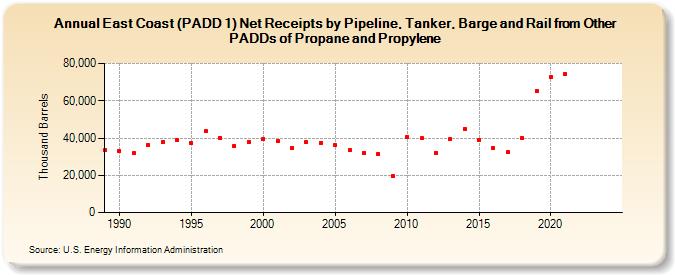
| East Coast (PADD 1) Net Receipts by Pipeline, Tanker, Barge and Rail from Other PADDs of Propane and Propylene (Thousand Barrels) | ||||||||
| Decade | Year-0 | Year-1 | Year-2 | Year-3 | Year-4 | Year-5 | Year-6 | Year-7 | Year-8 | Year-9 |
|---|---|---|---|---|---|---|---|---|---|---|
| 1980's | 33,385 | |||||||||
| 1990's | 33,042 | 31,780 | 36,288 | 37,679 | 38,925 | 37,259 | 43,631 | 40,198 | 35,736 | 38,042 |
| 2000's | 39,521 | 38,417 | 34,891 | 37,801 | 37,528 | 36,150 | 33,480 | 32,199 | 31,673 | 19,415 |
| 2010's | 40,726 | 39,774 | 32,200 | 39,220 | 45,047 | 38,797 | 34,812 | 32,318 | 40,062 | 65,212 |
| 2020's | 72,829 | 74,265 | -- | -- |
| - = No Data Reported; -- = Not Applicable; NA = Not Available; W = Withheld to avoid disclosure of individual company data. |
| Release Date: 3/29/2024 |
| Next Release Date: 8/30/2024 |