|
Download Data (XLS File) |
|
||||||||
|
||||||||
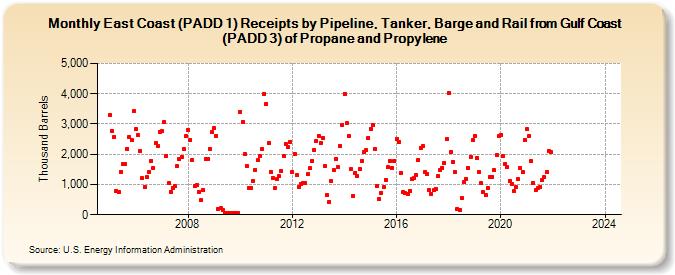
| East Coast (PADD 1) Receipts by Pipeline, Tanker, Barge and Rail from Gulf Coast (PADD 3) of Propane and Propylene (Thousand Barrels) | ||||||||
| Year | Jan | Feb | Mar | Apr | May | Jun | Jul | Aug | Sep | Oct | Nov | Dec |
|---|---|---|---|---|---|---|---|---|---|---|---|---|
| 2005 | 3,300 | 2,777 | 2,581 | 795 | 761 | 1,417 | 1,672 | 1,679 | 2,184 | 2,573 | 2,457 | 3,421 |
| 2006 | 2,835 | 2,620 | 2,109 | 1,202 | 913 | 1,233 | 1,415 | 1,788 | 1,546 | 2,369 | 2,281 | 2,740 |
| 2007 | 2,773 | 3,060 | 1,954 | 1,048 | 762 | 896 | 939 | 1,597 | 1,849 | 1,898 | 2,188 | 2,589 |
| 2008 | 2,812 | 2,473 | 1,809 | 948 | 987 | 760 | 485 | 820 | 1,842 | 1,844 | 2,178 | 2,732 |
| 2009 | 2,852 | 2,603 | 205 | 207 | 162 | 44 | 50 | 50 | 44 | 46 | 45 | 64 |
| 2010 | 3,410 | 3,071 | 2,007 | 1,614 | 897 | 890 | 1,115 | 1,482 | 1,795 | 1,945 | 2,172 | 4,003 |
| 2011 | 3,676 | 2,378 | 1,413 | 1,219 | 898 | 1,175 | 1,271 | 1,437 | 1,930 | 2,351 | 2,239 | 2,417 |
| 2012 | 1,412 | 2,023 | 1,311 | 929 | 1,031 | 1,047 | 1,050 | 1,333 | 1,533 | 1,792 | 2,141 | 2,434 |
| 2013 | 2,616 | 2,375 | 2,541 | 1,598 | 639 | 427 | 1,104 | 1,472 | 1,838 | 1,571 | 2,287 | 2,980 |
| 2014 | 4,005 | 3,018 | 2,616 | 1,497 | 625 | 1,381 | 1,264 | 1,511 | 1,789 | 2,081 | 2,129 | 2,545 |
| 2015 | 2,850 | 2,958 | 2,162 | 964 | 516 | 727 | 905 | 1,151 | 1,570 | 1,773 | 1,550 | 1,788 |
| 2016 | 2,509 | 2,414 | 1,365 | 749 | 715 | 698 | 790 | 1,191 | 1,204 | 1,299 | 1,818 | 2,222 |
| 2017 | 2,277 | 1,404 | 1,336 | 805 | 700 | 806 | 852 | 1,272 | 1,482 | 1,558 | 1,716 | 2,499 |
| 2018 | 4,025 | 2,079 | 1,758 | 1,411 | 203 | 151 | 553 | 1,068 | 1,184 | 1,557 | 1,909 | 2,461 |
| 2019 | 2,611 | 1,875 | 1,410 | 1,044 | 737 | 659 | 891 | 1,253 | 1,256 | 1,467 | 1,961 | 2,602 |
| 2020 | 2,649 | 1,940 | 1,682 | 1,569 | 1,118 | 1,028 | 770 | 907 | 1,170 | 1,531 | 1,407 | 2,482 |
| 2021 | 2,823 | 2,615 | 1,765 | 1,043 | 816 | 870 | 925 | 1,132 | 1,235 | 1,407 | 2,120 | 2,069 |
| 2022 | -- | -- | -- | -- | -- | -- | -- | -- | -- | -- | -- | -- |
| 2023 | -- | -- | -- | -- | -- | -- | -- | -- | -- | -- | -- | -- |
| 2024 | -- | |||||||||||
| - = No Data Reported; -- = Not Applicable; NA = Not Available; W = Withheld to avoid disclosure of individual company data. |
| Release Date: 3/29/2024 |
| Next Release Date: 4/30/2024 |