|
Download Data (XLS File) |
|
||||||||
|
||||||||
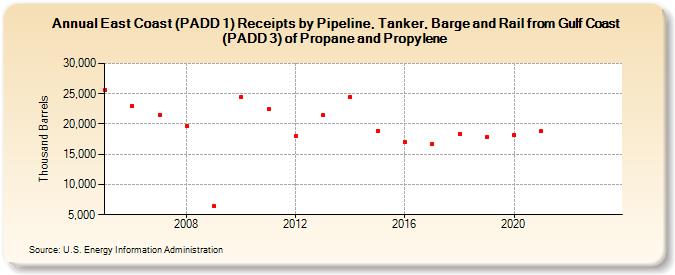
| East Coast (PADD 1) Receipts by Pipeline, Tanker, Barge and Rail from Gulf Coast (PADD 3) of Propane and Propylene (Thousand Barrels) | ||||||||
| Decade | Year-0 | Year-1 | Year-2 | Year-3 | Year-4 | Year-5 | Year-6 | Year-7 | Year-8 | Year-9 |
|---|---|---|---|---|---|---|---|---|---|---|
| 2000's | 25,617 | 23,051 | 21,553 | 19,690 | 6,372 | |||||
| 2010's | 24,401 | 22,404 | 18,036 | 21,448 | 24,461 | 18,914 | 16,974 | 16,707 | 18,359 | 17,766 |
| 2020's | 18,253 | 18,820 | -- | -- |
| - = No Data Reported; -- = Not Applicable; NA = Not Available; W = Withheld to avoid disclosure of individual company data. |
| Release Date: 8/30/2024 |
| Next Release Date: 8/29/2025 |