|
Download Data (XLS File) |
|
||||||||
|
||||||||
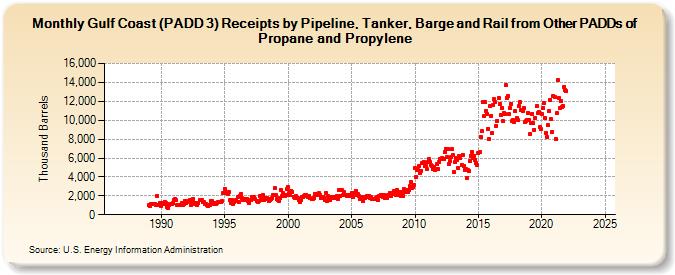
| Gulf Coast (PADD 3) Receipts by Pipeline, Tanker, Barge and Rail from Other PADDs of Propane and Propylene (Thousand Barrels) | ||||||||
| Year | Jan | Feb | Mar | Apr | May | Jun | Jul | Aug | Sep | Oct | Nov | Dec |
|---|---|---|---|---|---|---|---|---|---|---|---|---|
| 1986 | -- | -- | -- | -- | -- | -- | -- | -- | -- | -- | -- | -- |
| 1987 | -- | -- | -- | -- | -- | -- | -- | -- | -- | -- | -- | -- |
| 1988 | -- | -- | -- | -- | -- | -- | -- | -- | -- | -- | -- | -- |
| 1989 | 996 | 967 | 1,088 | 1,146 | 1,103 | 1,149 | 1,100 | 1,016 | 2,006 | 1,058 | 1,015 | 1,216 |
| 1990 | 949 | 1,246 | 1,131 | 1,390 | 1,273 | 821 | 748 | 1,005 | 1,108 | 1,126 | 1,181 | 1,209 |
| 1991 | 1,596 | 1,643 | 1,510 | 1,050 | 1,018 | 1,057 | 1,011 | 1,208 | 1,035 | 1,117 | 1,474 | 1,263 |
| 1992 | 1,370 | 1,424 | 1,480 | 1,527 | 1,080 | 1,295 | 1,638 | 1,270 | 1,150 | 1,225 | 1,075 | 1,208 |
| 1993 | 1,543 | 1,599 | 1,564 | 1,350 | 1,341 | 1,183 | 1,164 | 1,052 | 870 | 997 | 1,065 | 1,407 |
| 1994 | 1,411 | 1,124 | 1,185 | 1,268 | 1,137 | 1,284 | 1,336 | 1,298 | 1,361 | 1,399 | 2,269 | 2,347 |
| 1995 | 2,752 | 2,305 | 2,355 | 2,202 | 2,411 | 1,515 | 1,204 | 1,554 | 1,174 | 1,376 | 1,471 | 1,555 |
| 1996 | 1,886 | 1,306 | 1,989 | 2,142 | 1,744 | 1,577 | 1,545 | 1,619 | 1,516 | 1,690 | 1,434 | 1,229 |
| 1997 | 1,531 | 1,560 | 1,855 | 1,757 | 1,836 | 1,614 | 1,418 | 1,324 | 1,492 | 1,972 | 1,551 | 1,762 |
| 1998 | 2,090 | 1,593 | 1,816 | 1,710 | 1,742 | 1,680 | 1,442 | 1,561 | 1,628 | 1,808 | 2,082 | 2,829 |
| 1999 | 2,052 | 1,714 | 1,602 | 1,436 | 1,781 | 2,665 | 1,958 | 2,286 | 2,037 | 2,006 | 2,080 | 2,728 |
| 2000 | 2,897 | 2,252 | 2,055 | 2,493 | 2,412 | 1,895 | 1,818 | 1,979 | 1,737 | 1,757 | 1,510 | 1,302 |
| 2001 | 1,546 | 1,863 | 1,862 | 1,948 | 2,048 | 2,129 | 1,984 | 1,837 | 1,971 | 1,741 | 1,670 | 1,633 |
| 2002 | 1,772 | 2,209 | 2,050 | 2,051 | 2,193 | 2,247 | 2,093 | 1,816 | 1,728 | 1,918 | 1,804 | 1,514 |
| 2003 | 2,279 | 1,487 | 1,971 | 1,763 | 1,582 | 1,899 | 1,810 | 1,806 | 1,849 | 1,798 | 1,972 | 1,644 |
| 2004 | 2,631 | 2,001 | 2,613 | 2,568 | 2,054 | 2,356 | 2,098 | 2,036 | 2,002 | 2,033 | 1,950 | 2,060 |
| 2005 | 2,320 | 1,887 | 2,261 | 2,277 | 2,557 | 2,093 | 2,186 | 1,966 | 1,631 | 1,836 | 1,684 | 1,449 |
| 2006 | 1,895 | 1,774 | 1,832 | 1,954 | 2,025 | 1,814 | 1,901 | 1,698 | 1,648 | 1,654 | 1,637 | 1,768 |
| 2007 | 1,843 | 1,580 | 1,951 | 1,969 | 2,084 | 2,119 | 1,914 | 2,055 | 1,744 | 1,772 | 2,057 | 2,015 |
| 2008 | 2,283 | 1,995 | 2,299 | 2,143 | 2,474 | 2,353 | 2,119 | 2,563 | 2,097 | 2,448 | 2,204 | 1,999 |
| 2009 | 2,422 | 1,998 | 2,732 | 2,356 | 2,613 | 2,403 | 2,593 | 3,036 | 3,484 | 2,784 | 2,912 | 3,131 |
| 2010 | 4,950 | 3,938 | 4,770 | 4,697 | 5,160 | 4,425 | 4,662 | 5,457 | 5,587 | 5,149 | 5,262 | 4,846 |
| 2011 | 5,556 | 5,913 | 5,579 | 5,224 | 5,184 | 4,839 | 5,014 | 4,682 | 4,867 | 5,318 | 4,839 | 5,601 |
| 2012 | 5,935 | 5,886 | 6,044 | 5,843 | 6,613 | 6,988 | 6,070 | 6,931 | 5,379 | 5,643 | 6,109 | 6,904 |
| 2013 | 6,298 | 4,513 | 5,571 | 6,025 | 5,817 | 4,958 | 6,249 | 5,963 | 5,289 | 6,370 | 5,174 | 4,770 |
| 2014 | 4,838 | 3,909 | 4,692 | 4,651 | 5,644 | 6,187 | 6,654 | 6,010 | 6,260 | 5,776 | 5,522 | 5,221 |
| 2015 | 6,551 | 6,604 | 8,270 | 8,848 | 11,906 | 10,440 | 11,950 | 10,992 | 10,634 | 9,074 | 7,996 | 11,485 |
| 2016 | 10,482 | 8,595 | 11,606 | 12,200 | 11,920 | 9,407 | 9,964 | 12,324 | 11,691 | 10,584 | 11,330 | 9,902 |
| 2017 | 10,790 | 10,673 | 13,699 | 12,392 | 12,542 | 10,660 | 11,254 | 11,724 | 9,876 | 10,043 | 9,795 | 10,933 |
| 2018 | 10,237 | 9,987 | 11,456 | 11,908 | 11,073 | 11,117 | 10,987 | 11,308 | 9,813 | 9,878 | 10,035 | 10,789 |
| 2019 | 10,050 | 8,519 | 9,680 | 10,632 | 9,686 | 8,999 | 10,281 | 11,490 | 10,713 | 10,866 | 9,232 | 9,030 |
| 2020 | 10,641 | 11,292 | 11,785 | 10,281 | 8,612 | 8,245 | 9,454 | 10,949 | 12,142 | 10,092 | 8,752 | 12,527 |
| 2021 | 12,502 | 8,047 | 10,726 | 14,245 | 12,368 | 11,290 | 12,013 | 11,378 | 11,528 | 13,559 | 13,195 | 13,052 |
| 2022 | -- | -- | -- | -- | -- | -- | -- | -- | -- | -- | -- | -- |
| 2023 | -- | -- | -- | -- | -- | -- | -- | -- | -- | -- | -- | -- |
| 2024 | -- | |||||||||||
| - = No Data Reported; -- = Not Applicable; NA = Not Available; W = Withheld to avoid disclosure of individual company data. |
| Release Date: 3/29/2024 |
| Next Release Date: 4/30/2024 |