|
Download Data (XLS File) |
|
||||||||
|
||||||||
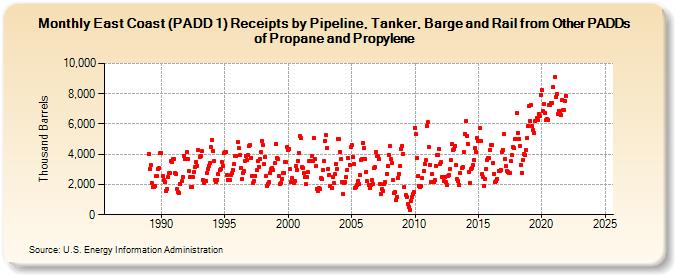
| East Coast (PADD 1) Receipts by Pipeline, Tanker, Barge and Rail from Other PADDs of Propane and Propylene (Thousand Barrels) | ||||||||
| Year | Jan | Feb | Mar | Apr | May | Jun | Jul | Aug | Sep | Oct | Nov | Dec |
|---|---|---|---|---|---|---|---|---|---|---|---|---|
| 1986 | -- | -- | -- | -- | -- | -- | -- | -- | -- | -- | -- | -- |
| 1987 | -- | -- | -- | -- | -- | -- | -- | -- | -- | -- | -- | -- |
| 1988 | -- | -- | -- | -- | -- | -- | -- | -- | -- | -- | -- | -- |
| 1989 | 4,047 | 3,027 | 3,285 | 2,105 | 1,810 | 1,863 | 1,927 | 2,592 | 2,559 | 3,021 | 3,069 | 4,080 |
| 1990 | 4,100 | 2,548 | 2,273 | 2,184 | 1,552 | 1,709 | 2,469 | 2,733 | 2,733 | 3,549 | 3,509 | 3,691 |
| 1991 | 3,708 | 2,762 | 2,705 | 1,715 | 1,494 | 1,438 | 2,041 | 2,200 | 2,503 | 3,894 | 3,661 | 3,659 |
| 1992 | 4,131 | 3,670 | 2,890 | 2,467 | 1,820 | 1,864 | 2,464 | 2,845 | 3,124 | 3,495 | 3,241 | 4,278 |
| 1993 | 3,840 | 3,869 | 4,196 | 2,313 | 2,110 | 2,215 | 2,240 | 2,726 | 3,051 | 3,232 | 3,421 | 4,466 |
| 1994 | 4,943 | 4,212 | 3,541 | 2,307 | 2,162 | 2,306 | 2,665 | 2,934 | 3,053 | 3,495 | 3,227 | 4,080 |
| 1995 | 4,153 | 4,136 | 2,603 | 2,324 | 2,265 | 2,302 | 2,648 | 2,762 | 2,958 | 3,342 | 3,867 | 3,899 |
| 1996 | 4,811 | 4,379 | 3,923 | 3,094 | 2,353 | 2,728 | 2,881 | 3,557 | 3,851 | 3,609 | 3,923 | 4,522 |
| 1997 | 4,594 | 3,780 | 2,554 | 2,098 | 2,241 | 2,568 | 2,939 | 3,531 | 3,187 | 3,682 | 4,145 | 4,879 |
| 1998 | 4,630 | 3,339 | 3,801 | 2,562 | 1,903 | 2,061 | 2,189 | 2,773 | 3,044 | 3,094 | 2,931 | 3,409 |
| 1999 | 4,683 | 3,760 | 3,662 | 2,560 | 2,024 | 2,109 | 2,360 | 2,727 | 2,787 | 3,464 | 3,468 | 4,474 |
| 2000 | 4,296 | 4,376 | 3,013 | 2,136 | 2,409 | 2,112 | 2,239 | 3,205 | 2,965 | 3,574 | 4,072 | 5,185 |
| 2001 | 5,090 | 3,122 | 3,120 | 2,766 | 2,475 | 2,004 | 2,480 | 2,804 | 3,582 | 3,576 | 3,902 | 3,533 |
| 2002 | 5,100 | 3,670 | 3,203 | 1,730 | 1,588 | 1,752 | 1,698 | 2,419 | 2,349 | 2,988 | 3,550 | 4,854 |
| 2003 | 5,252 | 4,429 | 3,039 | 2,655 | 1,929 | 1,799 | 2,522 | 2,099 | 2,674 | 3,339 | 3,055 | 5,009 |
| 2004 | 4,994 | 4,155 | 3,656 | 2,181 | 1,362 | 2,069 | 2,153 | 2,466 | 2,989 | 3,731 | 3,317 | 4,455 |
| 2005 | 4,639 | 3,800 | 3,384 | 1,741 | 1,815 | 1,956 | 2,231 | 2,030 | 2,638 | 3,595 | 3,652 | 4,739 |
| 2006 | 4,416 | 3,677 | 2,855 | 2,202 | 1,991 | 1,744 | 1,938 | 2,275 | 2,015 | 3,067 | 3,154 | 4,146 |
| 2007 | 3,914 | 3,859 | 3,693 | 2,022 | 1,395 | 1,671 | 1,567 | 2,023 | 2,162 | 2,712 | 3,206 | 3,975 |
| 2008 | 4,559 | 3,652 | 3,439 | 2,264 | 1,405 | 1,471 | 984 | 1,170 | 2,452 | 2,722 | 3,224 | 4,331 |
| 2009 | 4,554 | 4,040 | 1,836 | 1,303 | 1,184 | 699 | 540 | 334 | 903 | 1,142 | 1,380 | 1,500 |
| 2010 | 5,761 | 5,311 | 3,762 | 2,571 | 1,890 | 1,807 | 1,931 | 2,416 | 2,918 | 3,339 | 3,589 | 5,885 |
| 2011 | 6,106 | 4,503 | 3,319 | 2,178 | 2,707 | 2,141 | 2,147 | 2,296 | 3,242 | 3,950 | 3,937 | 4,342 |
| 2012 | 3,378 | 3,462 | 2,482 | 2,233 | 2,494 | 2,147 | 1,947 | 2,555 | 2,656 | 3,032 | 3,598 | 4,681 |
| 2013 | 4,271 | 4,378 | 4,571 | 3,257 | 2,346 | 2,198 | 1,977 | 2,730 | 3,097 | 3,142 | 4,147 | 5,361 |
| 2014 | 6,184 | 5,195 | 4,704 | 2,846 | 2,121 | 3,025 | 3,096 | 3,275 | 3,639 | 4,436 | 4,177 | 5,045 |
| 2015 | 4,904 | 5,701 | 4,862 | 2,667 | 2,512 | 1,890 | 2,336 | 3,024 | 3,586 | 3,722 | 3,744 | 4,291 |
| 2016 | 4,588 | 4,636 | 3,431 | 2,720 | 2,170 | 2,234 | 2,393 | 2,896 | 2,864 | 2,979 | 4,131 | 4,301 |
| 2017 | 5,308 | 3,681 | 3,228 | 2,902 | 2,808 | 2,753 | 2,759 | 3,531 | 3,957 | 4,508 | 4,425 | 5,027 |
| 2018 | 6,730 | 5,420 | 5,018 | 4,564 | 3,320 | 2,783 | 3,633 | 3,997 | 3,947 | 4,277 | 5,090 | 5,848 |
| 2019 | 7,172 | 6,194 | 7,271 | 5,849 | 5,605 | 5,388 | 6,187 | 6,396 | 6,288 | 6,690 | 6,514 | 7,898 |
| 2020 | 8,275 | 6,858 | 7,331 | 6,745 | 6,245 | 6,341 | 6,285 | 7,267 | 7,236 | 7,403 | 7,400 | 8,443 |
| 2021 | 9,082 | 7,761 | 7,989 | 6,666 | 6,872 | 6,859 | 6,564 | 7,571 | 6,896 | 6,953 | 7,518 | 7,871 |
| 2022 | -- | -- | -- | -- | -- | -- | -- | -- | -- | -- | -- | -- |
| 2023 | -- | -- | -- | -- | -- | -- | -- | -- | -- | -- | -- | -- |
| 2024 | -- | |||||||||||
| - = No Data Reported; -- = Not Applicable; NA = Not Available; W = Withheld to avoid disclosure of individual company data. |
| Release Date: 3/29/2024 |
| Next Release Date: 4/30/2024 |