|
Download Data (XLS File) |
|
||||||||
|
||||||||
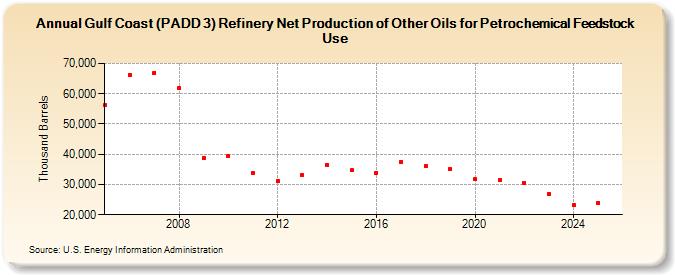
| Gulf Coast (PADD 3) Refinery Net Production of Other Oils for Petrochemical Feedstock Use (Thousand Barrels) | ||||||||
| Decade | Year-0 | Year-1 | Year-2 | Year-3 | Year-4 | Year-5 | Year-6 | Year-7 | Year-8 | Year-9 |
|---|---|---|---|---|---|---|---|---|---|---|
| 2000's | 56,266 | 66,299 | 66,970 | 61,772 | 38,761 | |||||
| 2010's | 39,436 | 33,868 | 31,108 | 33,057 | 36,452 | 34,680 | 33,907 | 37,522 | 36,038 | 35,039 |
| 2020's | 31,649 | 31,628 | 30,610 | 26,746 |
| - = No Data Reported; -- = Not Applicable; NA = Not Available; W = Withheld to avoid disclosure of individual company data. |
| Release Date: 6/28/2024 |
| Next Release Date: 8/30/2024 |