|
Download Data (XLS File) |
|
||||||||
|
||||||||
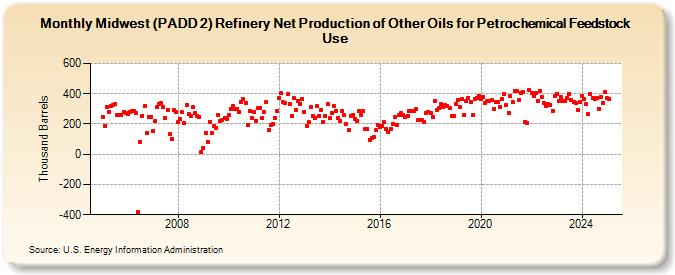
| Midwest (PADD 2) Refinery Net Production of Other Oils for Petrochemical Feedstock Use (Thousand Barrels) | ||||||||
| Year | Jan | Feb | Mar | Apr | May | Jun | Jul | Aug | Sep | Oct | Nov | Dec |
|---|---|---|---|---|---|---|---|---|---|---|---|---|
| 2005 | 247 | 186 | 315 | 281 | 317 | 327 | 331 | 260 | 257 | 262 | 279 | 275 |
| 2006 | 265 | 278 | 284 | 284 | 271 | -385 | 84 | 254 | 317 | 141 | 248 | 248 |
| 2007 | 152 | 217 | 315 | 331 | 336 | 309 | 237 | 295 | 133 | 100 | 291 | 278 |
| 2008 | 212 | 232 | 277 | 206 | 328 | 265 | 256 | 309 | 271 | 254 | 246 | 16 |
| 2009 | 39 | 143 | 83 | 215 | 142 | 185 | 172 | 259 | 220 | 223 | 240 | 235 |
| 2010 | 257 | 298 | 318 | 300 | 300 | 277 | 345 | 364 | 341 | 191 | 284 | 241 |
| 2011 | 278 | 221 | 303 | 307 | 239 | 280 | 343 | 159 | 192 | 200 | 240 | 286 |
| 2012 | 372 | 403 | 344 | 340 | 397 | 331 | 254 | 371 | 290 | 353 | 335 | 367 |
| 2013 | 282 | 189 | 212 | 311 | 254 | 241 | 321 | 256 | 293 | 216 | 256 | 332 |
| 2014 | 238 | 275 | 316 | 288 | 240 | 218 | 285 | 258 | 202 | 161 | 255 | 260 |
| 2015 | 235 | 220 | 283 | 260 | 283 | 164 | 167 | 97 | 110 | 111 | 159 | 195 |
| 2016 | 183 | 189 | 210 | 166 | 147 | 169 | 200 | 246 | 194 | 260 | 270 | 258 |
| 2017 | 244 | 255 | 289 | 287 | 287 | 297 | 226 | 227 | 223 | 210 | 274 | 279 |
| 2018 | 271 | 245 | 352 | 293 | 306 | 330 | 315 | 323 | 319 | 308 | 254 | 256 |
| 2019 | 330 | 361 | 315 | 362 | 260 | 351 | 375 | 348 | 259 | 362 | 374 | 385 |
| 2020 | 367 | 376 | 337 | 350 | 355 | 360 | 301 | 345 | 342 | 313 | 362 | 400 |
| 2021 | 325 | 273 | 385 | 346 | 419 | 416 | 361 | 408 | 411 | 215 | 206 | 422 |
| 2022 | 403 | 383 | 408 | 350 | 417 | 380 | 340 | 318 | 332 | 328 | 286 | 388 |
| 2023 | 399 | 351 | 377 | 351 | 353 | 374 | 398 | 361 | 345 | 337 | 292 | 348 |
| 2024 | 382 | |||||||||||
| - = No Data Reported; -- = Not Applicable; NA = Not Available; W = Withheld to avoid disclosure of individual company data. |
| Release Date: 3/29/2024 |
| Next Release Date: 4/30/2024 |